
The Market's Breadth is Bad, but Does it Matter?
“History Doesn't Repeat Itself, but It Often Rhymes” – Mark Twain.
Technically, yes, this time will be different because cycles are never identical, but the result could very well be the same. When it comes to the current market condition, it is no secret that we have a major breadth issue on our hands, but the real issue is whether or not it will matter. There is a lot of noise swirling around in the headlines, so let’s start with the facts before we bring in opinions…
-
The SPY and QQQ ETFs have both continued to churn out all time record highs, up 17% and 24% respectively YTD
-
The top five sectors ranked by MOTR remain cyclical (Finance, Industrial, Tech, Materials, and Consumer Discretionary)
-
Stocks in the MOTR MANAGeMeNT Index (MSFT, AMZN, NFLX, AAPL, GOOGLe, MeTA, NVDA, TSLA) make up 46% of QQQ and 33% of SPY
-
Despite the SPY’s record highs, 30% of stocks in the MOTR Universe (2800 stocks) are in a clear downtrend on their weekly chart and 28% on their monthly chart.
-
Technology (RSPT) & Utilities (RSPU) are the only equally weighted sector ETFs currently above their March high
-
Every sector but Tech has more stocks in a downtrend than uptrend on their weekly chart.
Two things can be true at once: we can have poor breadth across the market while the popular averages roar higher. This is why breadth isn’t a great market timing tool, but rather, a signal to be cautious which is our stance here at MOTR Research . We began bracing for impact as NVDA rocketed to 40 times sales because we’ve seen this horror movie many times before. So much hype builds around an amazing company with undeniable future promise that the public pulls all that growth into the present with incessant buying, resulting in extraordinarily high valuations.
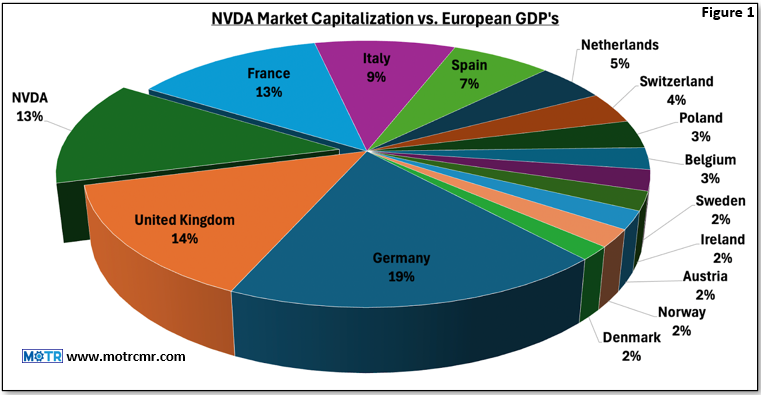
While NVDA is clearly a dominant player in the AI space, it is hard to look at a graphic like Figure 1, which plots NVDA’s market cap against the largest countries in Europe by GDP, and not be slightly concerned that it would be the third largest country!
Similar valuation extremes have occurred in the past, whether it be the late 1920s, early 1970s, late 1990s, and even 2021, and in each case, it was argued that this time , valuations were justified based on future growth prospects. Invariably, each time ended badly because investors underappreciated the difference between a great company and an awful stock. The line in the sand between the two is almost always valuation. In the past, the stocks of these great growth companies plummeted, many falling more than -90% , even though the companies went on to meet or exceed the lofty growth expectations embedded in their insane valuations. Great company, awful stock.
Having navigated similar environments over the past 30 years, we want to stress two things: 1) although most poor breadth environments have historically ended badly (at times, catastrophically so), some have not, so we must keep an open mind, and 2) although current conditions are not great, they are also not yet bearish. Our MOTR Risk Gauge remains on the bullish side of neutral for now, leaving us still buying pullbacks and base breakouts in leadership stocks.
The MOTR Research process has effectively helped identify and navigate every major bull and bear market since the late 1990s. If you want to stay updated with what we are seeing, head on over to MOTR Research for a trial of our research. We publish 20-40 buy ideas each week (and short ideas in bear markets), on top of timely weekly market reports and monthly videos. We have a 30 day free trial , so why not give it a try?
Thank you for reading.
David Lundgren, CMT CFA