
Zephyr K-ratio
Risk Metrics Series
The objective of this ongoing educational series of blog posts is to sort through, explain, and organize all of the various performance metrics that are available to the financial analyst, but most investors really want just two things:
- They want their wealth to appreciate at a rapid rate
- They do not want to deviate from that path of wealth appreciation
Luckily, there’s a ratio for that: Zephyr K-Ratio [1] . This ratio measures the consistency of wealth creation over time.
The Steeper the Slope, The Faster the Climb
Let’s begin with an illustration to help understand this new metric.
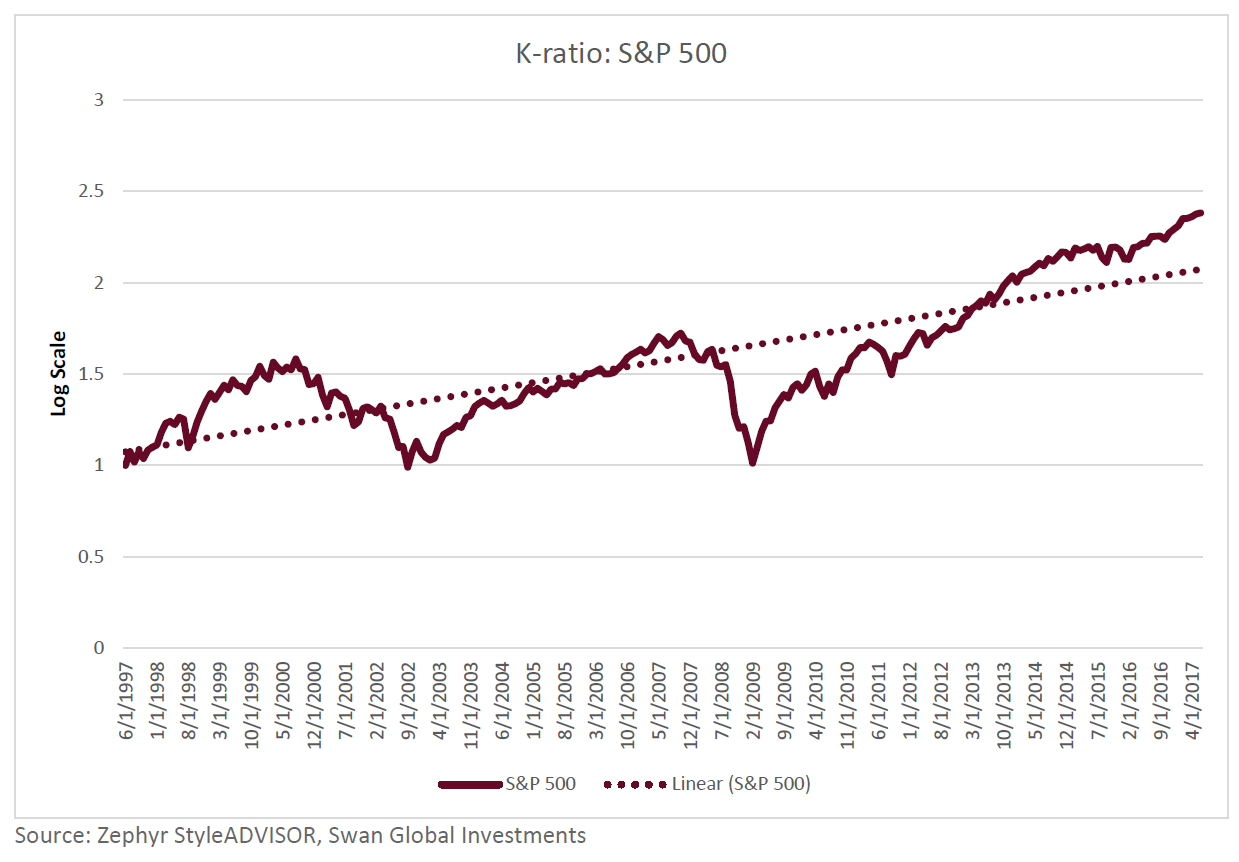
Below we see a cumulative return graph for the S&P 500 over the last 20 years [2] . Superimposed over the actual data is a straight, best-fit line.
More from Swan Global Investments