XLV Made New Highs From The Elliott wave Blue Box Area
In this technical blog, we will look at the past performance of 1 hour Elliott Wave Charts of XLV, which we presented to members at the elliottwave-forecast. In which, the rally from 25 March 2021 low ended 5 waves impulse rally and made a pullback. And we knew that the structure is incomplete for 1 more high at least to complete the 5 waves sequence & it should see more strength. Therefore, we advised members not to sell the ETF & buy the dips in 3, 7, or 11 swings at the blue box areas. We will explain the structure & forecast below:
XLV 1 Hour Elliott Wave Chart
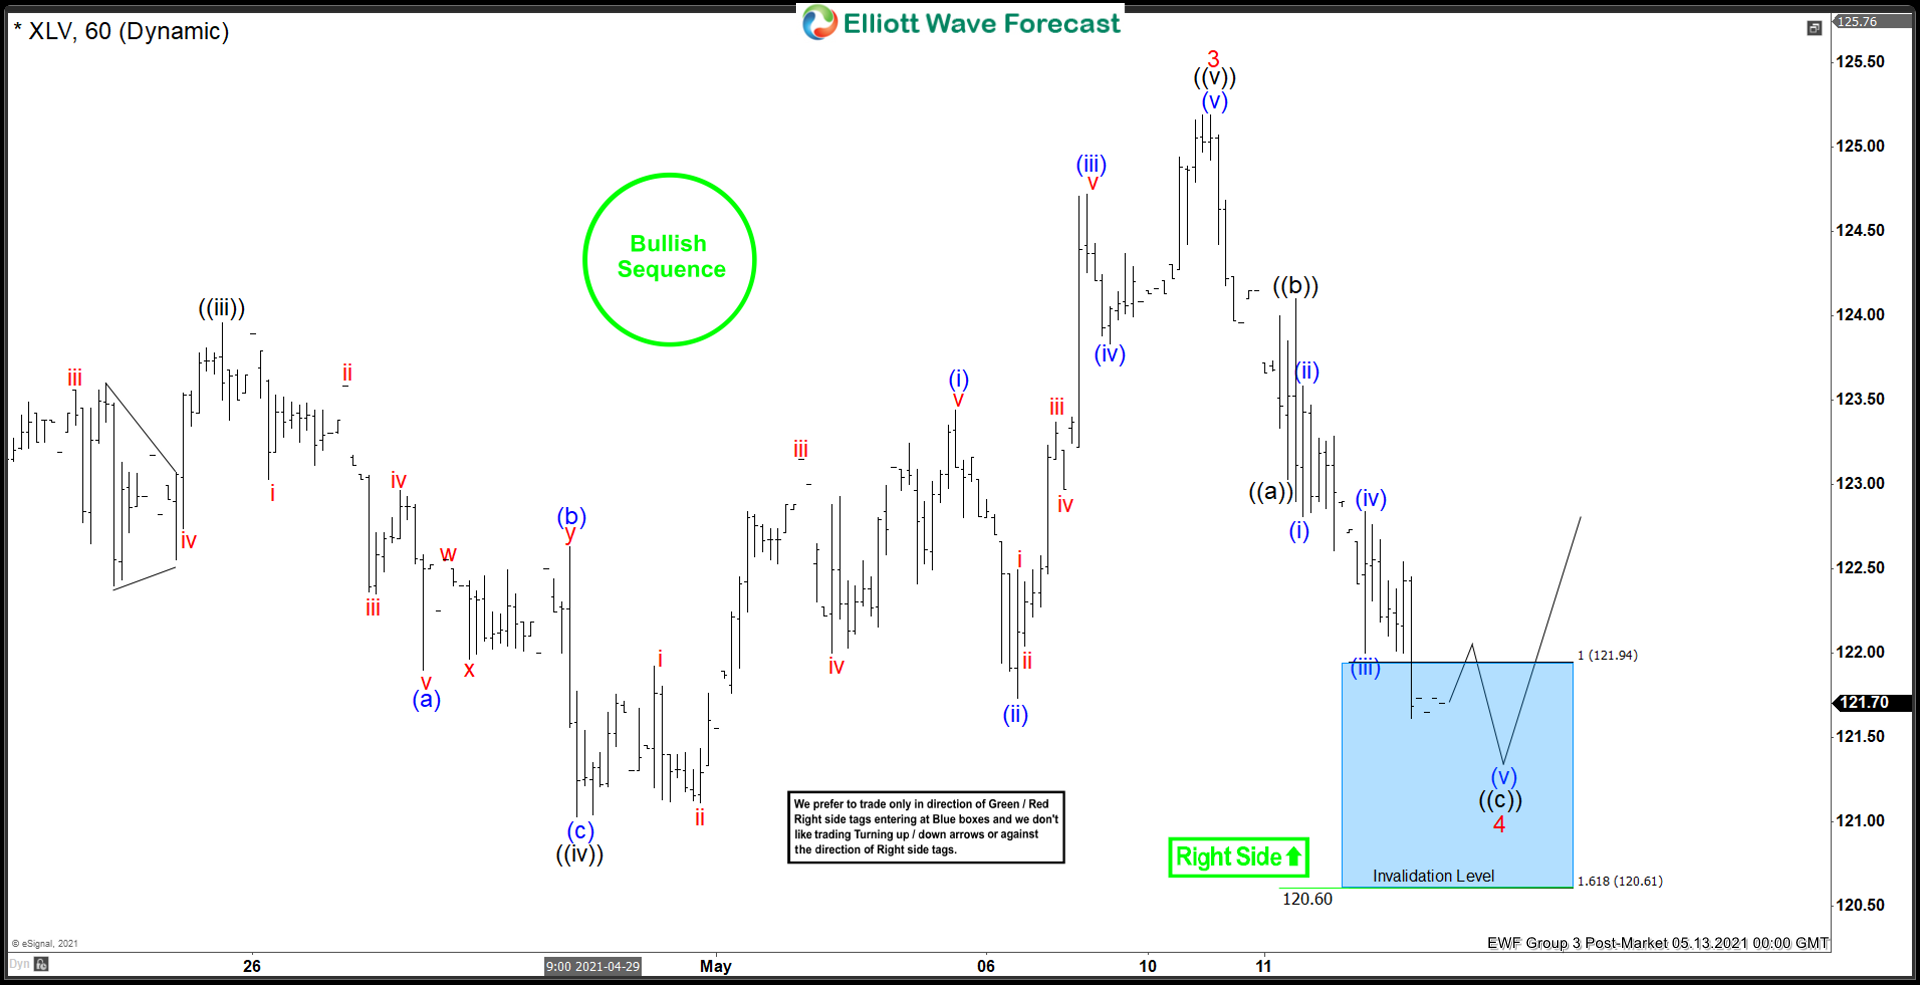
Above is the 1hr Elliott wave chart of XLV from 5/13/2021 Post-Market update. In which the rally to $125.19 high ended the cycle from 3/25/2021 low in 5 waves structure within wave 3. Down from there, the stock made a pullback in wave 4. The internals of that pullback unfolded as Elliott wave zigzag structure where wave ((a)) ended at $123.03 low. Wave ((b)) bounced ended at $124.10 high. Then wave ((c)) managed to reach the $121.94- $120.61 blue box area. From where next leg higher was expected to take place looking for a new high ideally or for a 3 wave bounce at least.
XLV 1 Hour Elliott Wave Chart

Here’s the latest 1hr chart from the 5/30/2021 Weekend update. The XLV is showing a strong reaction higher taking place from the blue box area after ending the zigzag correction within wave 4 at $121.38 low. Allowed members to create a risk-free position shortly after taking the long positions at the blue box area.
Source: https://elliottwave-forecast.com/stock-market/xlv-made-new-highs-blue-box-area/
