Will XBI Crash 61.78 Low? Analyzing the Biotech ETF's Correction
The SPDR S&P Biotech ETF (XBI) is an exchange-traded fund that tracks the biotechnology segment of the S&P Total Market Index. This ETF allows investors to gain exposure to large, mid, and small-cap biotech stocks. If you’re interested in biotechnology, XBI could be worth exploring further. Here are some of its top holdings and their percentage weights: United Therapeutics Corporation (UTHR): 2.92%. Exact Sciences Corporation (EXAS): 2.91%. Gilead Sciences, Inc. (GILD): 2.89%. Sarepta Therapeutics, Inc. (SRPT): 2.87%. Amgen Inc. (AMGN): 2.84%. Alnylam Pharmaceuticals, Inc. (ALNY): 2.65%. Regeneron Pharmaceuticals, Inc. (REGN): 2.64%. Vertex Pharmaceuticals Incorporated (VRTX): 2.60%. AbbVie Inc. (ABBV): 2.60%. BioMarin Pharmaceutical Inc. (BMRN): 2.56%.
In November, we called a leading diagonal structure completed as wave (I). The market had started a wave (II) correction, and we are looking for more downside for buying dips. You can check out the old blog here: Biotech ETF Ended a Diagonal. Looking for Buying Dips
XBI Weekly Chart November 25th, 2024
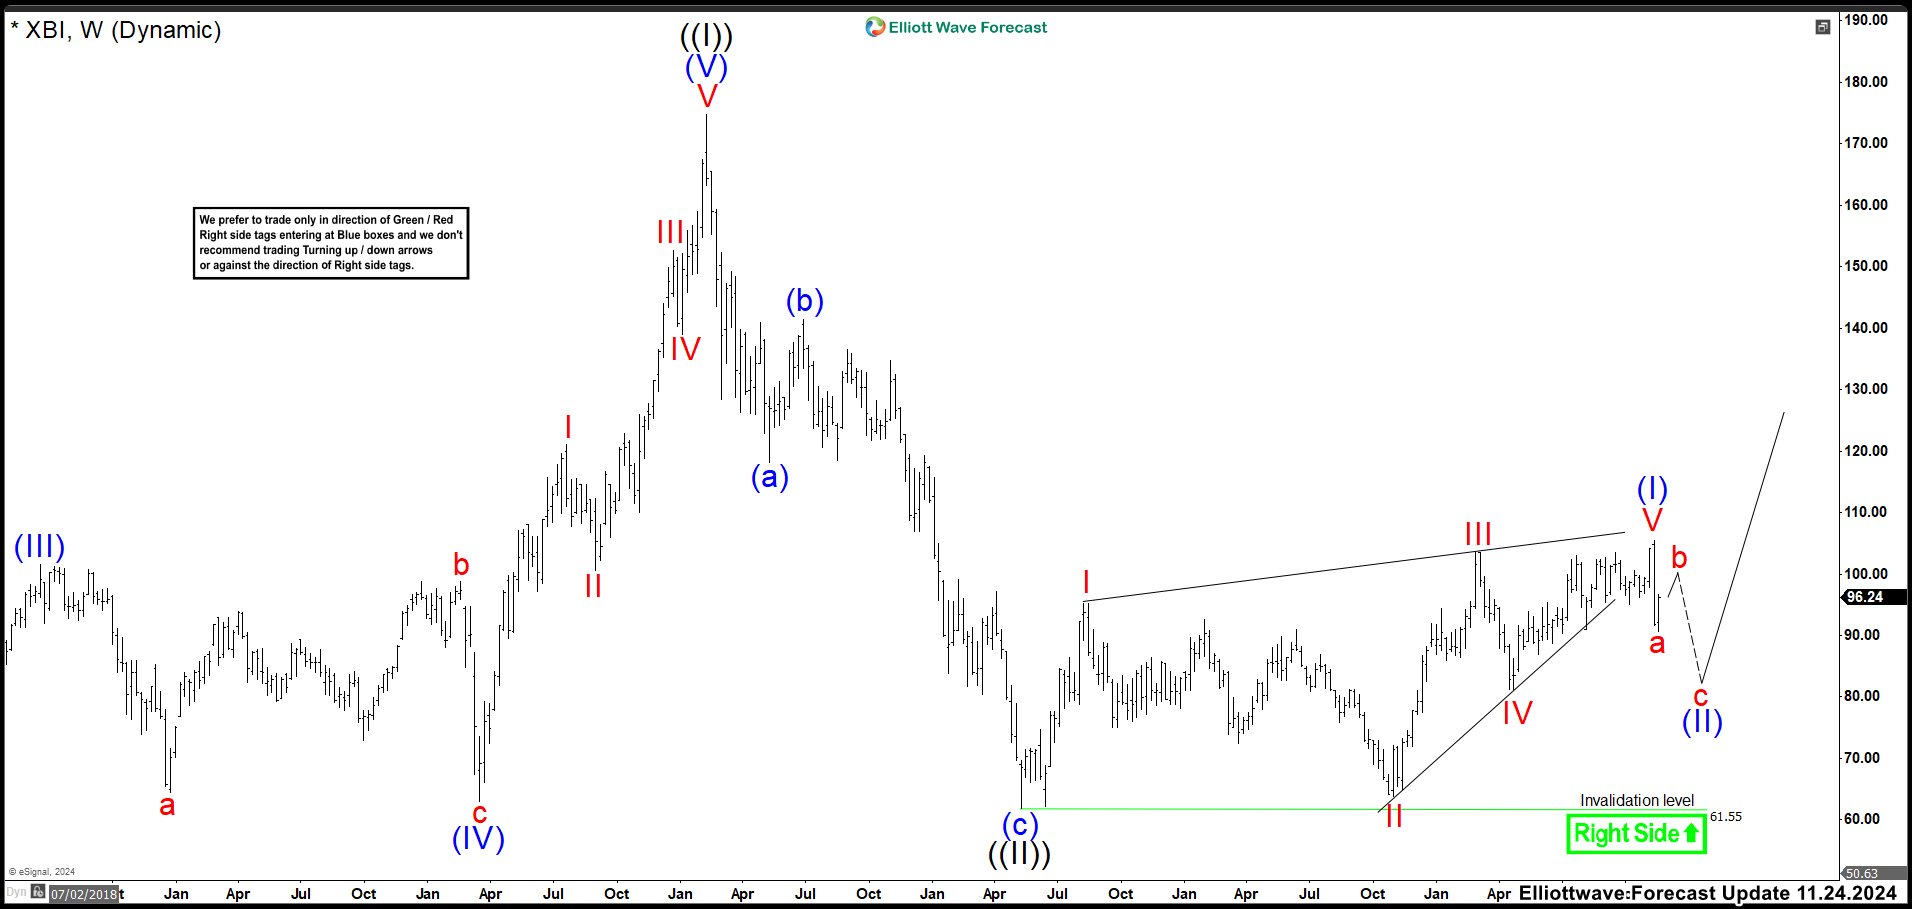
The wave I of the diagonal ended at 95.17 high. Then wave II built a zig zag correction with a flat structure in the middle. This pullback ended at 63.80 low and rally again. Wave III did a strong movement as wave I reaching 103.53 high. The retracement as wave IV finished at 81.14. The last push to the upside was a little irregular. It could be labeled as a ending diagonal to 105.47 high, completing wave V and wave (I). Then, the wave (II) has started, and we were looking to end 3, 7 or 11 swings correction where we like to buy the dips against 61.78 low.
XBI Weekly Chart April 05th 2025
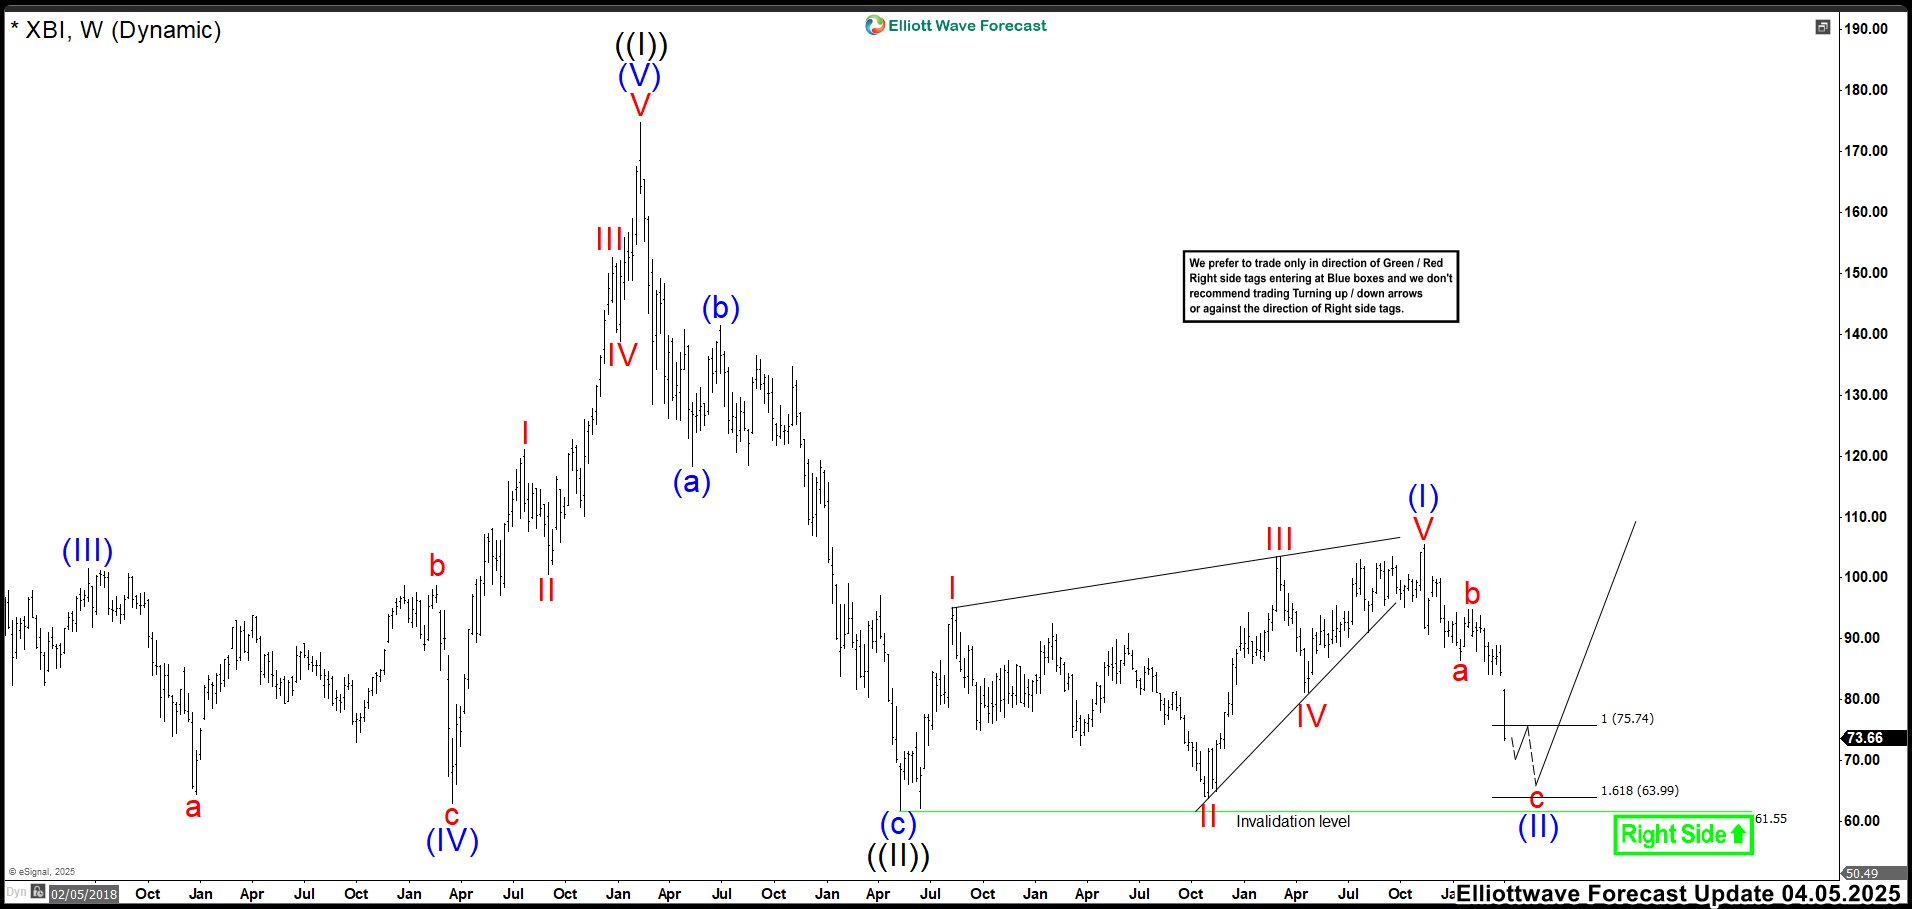
After a few months, we can clearly see that the correction had begun. Wave "a" formed a leading diagonal ending at a low of 86.40. While the correction as wave "b" concluded at 88.98 high. XBI has entered an extreme zone to complete wave (II). We should observe an impulse structure moving downward from wave "b" to assess the possibility of the correction ending. Currently, the market is moving within wave ((3)) of "c" and continues to decline sharply. For no reason can we rule out the market breaking below 61.78. If the zone proves to be a good support, great; but if not, breaking below 61.78 could send the Biotechnology sector to the 41.33 - 36.09 area.
Let's see what the market brings us. Trade Smart!
Source: https://elliottwave-forecast.com/stock-market/biotech-etf-xbi-crash-next-rally/