
WHERE DO WE GO FROM HERE?
April 23, 2019
QS Research Group
The current market environment may be well-suited for investors looking to rebalance equity portfolios to lower overall volatility.
Based on headline numbers, the U.S. equity market today looks a lot like it did in September 2018. From the February 2018 bottom to the September 2018 peak, the market was up nearly 15%. Year-to-date, as of the end of Q1 2019, US equities are up over 21%, from the December 2018 correction low.1
A confluence of events, including a cautious Federal Reserve (Fed) pausing future interest rate increases, supportive economic fundamentals in the U.S. and the promise of a US-China trade agreement have propped the market up.
While the US continues to grow at a moderate pace, we believe uncertainty lurks on the horizon. That uncertainty could bring bouts of volatility similar to those experienced in the February and December 2018 corrections. While volatility expectations, as measured by the Chicago Board Options Exchange Volatility Index (VIX), remain contained, S&P 500 companies are expected to report a nearly 4% drop in Q1 2019 earnings marking the first decline in year over year earnings since Q1 2016. Additionally, non-market based measures such as the Global Economic Policy Uncertainty Index paint a gloomy picture.
Global Economic Policy Uncertainty Index
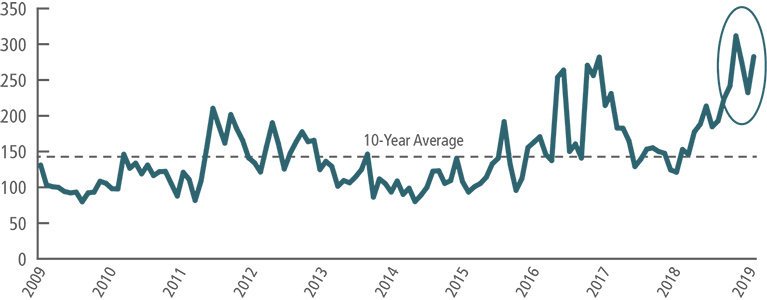
Source: Bloomberg, from March 31, 2009 through March 31, 2019. Past performance is no guarantee of future results. Indexes are unmanaged, and not available for direct investment. Index returns do not include fees or sales charges. This information is provided for illustrative purposes only and does not reflect the performance of an actual investment.
Against this backdrop, we believe that now is a prudent time for investors to assess the durability of their equity portfolios with a refined focus on equity valuations and the embedded cyclicality, in the composition of the S&P 500 Index. As was seen in Q4 2018, the cyclical sectors which comprise over 75% of the S&P 500 have a higher overall beta and are potentially more susceptible to deeper drawdowns than their non-cyclical counterparts.
S&P 500 Index Composition
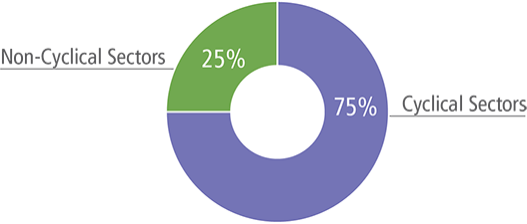
Source: Bloomberg, based on GICS exposure as of March 31, 2019. Indexes are unmanaged, and not available for direct investment. Index returns do not include fees or sales charges. This information is provided for illustrative purposes only and does not reflect the performance of an actual investment. Cyclical Sectors (Communication Services, Consumer Discretionary, Energy, Financials, Industrials, Information Technology, Materials and Real Estate). Non-Cyclical Sectors (Health Care, Utilities and Consumer Staples).
Additionally, sectors such as Information Technology, Materials and Energy -- which together make up 30% of the market cap weighted index and have helped drive the market rally year to date -- are expected to realize a negative double-digit earnings growth decline. In contrast, defensive sectors such as Utilities and Health Care which are both expected to report positive year over year earnings growth.
S&P 500 Index earnings growth: Q1 2019
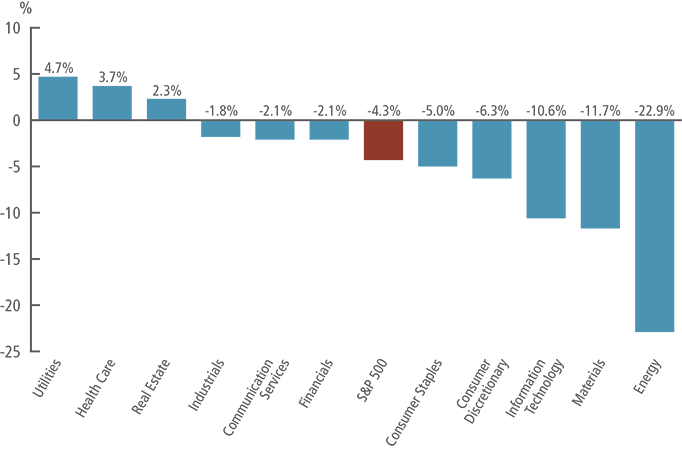
Source: FactSet, as of March 31, 2019. Past performance is no guarantee of future results. Indexes are unmanaged, and not available for direct investment. Index returns do not include fees or sales charges. This information is provided for illustrative purposes only and does not reflect the performance of an actual investment.
In our opinion, the current market environment might mark an opportune time for investors to rebalance portfolios away from cyclical, high beta stocks, diversifying into defensively oriented stocks which may lower overall volatility and dampen drawdowns amid bouts of volatility.