Volatility – Liability to Change Rapidly and Unpredictably, Especially for the Worse
Robert Baker, President, Advanced Asset Management Advisors (AAMA)
Volatility is often cited in the financial media with negative connotations. Before we get into our comments, there are two important concepts to bear in mind:
- Media citations are almost always quoting expected volatility (the ‘VIX’) which is an indication of volatility that will be experienced in the future. The VIX is calculated from options pricing models by solving for implied volatility. This can be totally different from realized volatility that prices actually experience over time. Think of your teenager’s sleeping habits. During the school year, the experienced bedtime and wake times are very consistent (low volatility). However, as summer approaches one would expect the volatility to increase…and when it comes time to go away to college, we would like to expect lower volatility, but realized volatility in sleeping habits will likely be higher.
- Volatility is usually associated with declining prices (as defined “especially for the worse”). However, volatility can increase during periods of rising prices. Prices can generally rise, but experience wider price swings along the way. This is what we call “good volatility”.
There are expected volatility indices for just about everything today. U.S. Stocks, Chinese Stocks, Emerging Market Indices, Oil, Bonds, Brazilian Stocks. If options trade, it can be calculated. And, of course, realized volatility can be calculated on any historical price series.
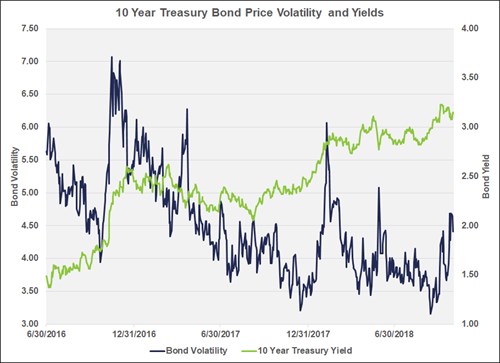
Let’s start with the bond market first. This chart starts with the low of interest rates on June 30, 2016 at 1.40%. Since then yields have risen steadily to 3.25% (blue plot) and volatility, as measured by the CBOE 10 Year Treasury Note Volatility Index, has experienced several spikes higher. The most noticeable are in November, 2016, January, 2018 and recently. Note that all of these spikes occurred during periods when rates were accelerating. The best way to avoid volatility in the bond market is to own short-term bonds, which is what we have done within our fixed income portfolios. They have been invested in short-term, investment grade bonds for some time so there was no need to react to these changes in the bond market.
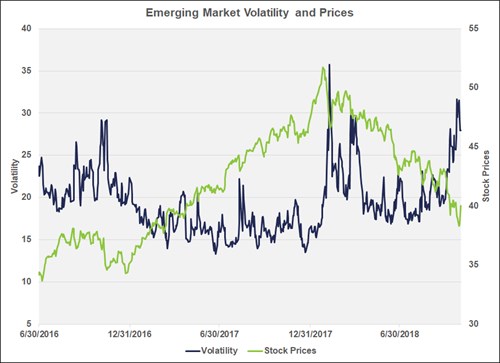
Emerging market stock prices have been weak and more volatile as well. You will note that the spikes in volatility in the summer of 2016, January-February of 2018 and recently have all been associated with stock price declines. The best way to avoid volatility in emerging markets is to reduce or eliminate exposure to these markets. While most international funds will have a bit of exposure, we eliminated our position in Emerging Market funds last spring. The logic was not based simply on increased volatility, but on interest rates trends. Emerging market countries have a higher than nor-mal amount of dollar-denominated debt out-standing. A strong dollar and higher interest rates create a double barrel negative scenario for rising debt service costs. Extreme situations as we have seen in Turkey and Argentina can have ripple effects in other markets.
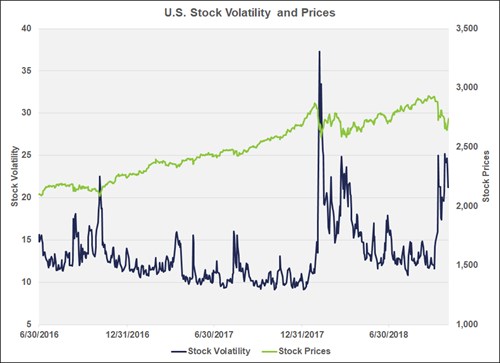
And finally, to the U.S. stock market. Here the story is similar to the bond and emerging markets. Volatility, as measured by the CBOE Volatility Index (VIX), has increased and prices have declined. One might suggest that it would be simple to just sell stocks to avoid ‘volatility’. However, trading/timing the market is a very difficult and seldom rewarded adventure. Our approach in the U. S. stock market is the same as in the bond market and international markets. We did not go to cash but moved allocations to-wards segments of the bond market and international markets that were viewed as less risky. In the U.S. stock market that has been a bit more complicated as the market has been led by a handful of large company stocks over the last two years. These were dubbed the FAANG stocks some time ago. They are very large and therefore have an outsized influence on cap-weighted market indices. Our sector selection process looks at relative valuation and earnings growth. The technology sector has been relatively attractive as well as the health care sector. These are a perfect match because the tech sector is more volatile (both ‘good’ and ‘bad’ volatility), while the health care sector tends to be less volatile. Both sectors have been well-represented in our portfolios and the relatively low volatility of the health care sector dampens the higher volatility in the tech sector.
In conclusion, we would like to remind you that our commentaries over the last several quarters have emphasized the trend towards higher interest rates and the disappearance of dollars. We have also commented that the U.S. stock market would need to adjust to these new trends. It is. If you glance back at the volatility comments on the three markets outlined above, you will remember a common phrase “increased volatility and price weakness in November 2016, January-February 2018, and recently”. All the markets are moving and we suspect the bond market is the culprit for a lot of this. The interest rate trends are not likely to reverse dramatically, as we expect between $1.5 and $2.0 Trillion of bond supply in the U.S. Treasury market over the next twelve months. And foreign sellers add another potential wild card into the mix.
We will continue to adjust our portfolio allocations to positions that we calculate as having the best risk-reward value. Over the long term, we expect to add value to our clients’ portfolios.
The post Volatility – Liability to Change Rapidly and Unpredictably, Especially for the Worse appeared first on FTJ FundChoice .
RSS Import: Original Source
