Using Principal Component Analysis (PCA) on a Stock/ETF Portfolio Correlation Matrix.
The following calculations and definitions are taken from ZOONOVA
Here is the calculation of Principal Component Analysis using a Stock portfolio correlation matrix. First calculate the Stock Correlation matrix
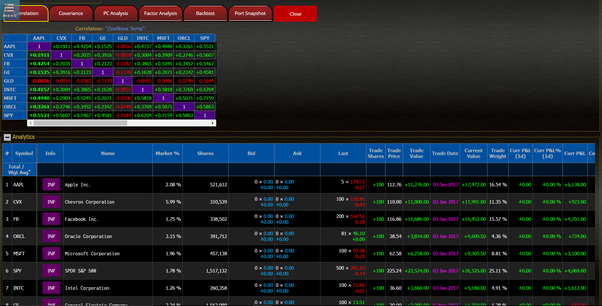
Take the correlation matrix as input and calculate Principal Component Analysis (PCA) for the portfolio.
Explanation of PCA and the fields.
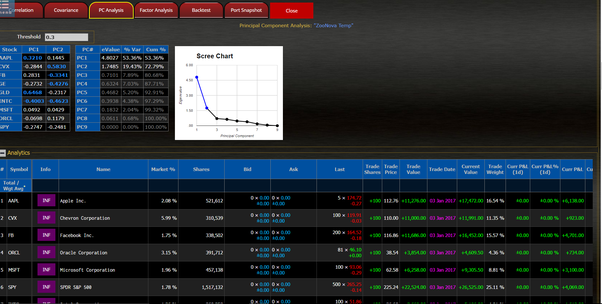
PC Analysis
Principal component analysis is a statistical technique used to analyze the interrelationships between a large number of variables and to explain them in terms of a smaller set of variables (i.e., "principal components"). Using the correlation matrix for the stock watch portfolio, eigenvalues and eigenvectors are calculated – which imply corresponding principal components. The output is as follows:
Principal component coefficients (Reduced Model)
Principal component coefficients displays eigenvectors for the principal components ( NOTE: components with an eigenvalue of less than 1 are omitted, i.e., "Reduced"). Values with a high correlation (relative to the user-defined threshold) between the principal components and the (standardized) original variables are highlighted.
Total Variance Explained
The number of components matches the number of unique stocks in a stock portfolio. Because PCA uses the correlation matrix, the variables are standardized: Values along the correlation diagonal are equal to 1, and the total variance is equal to the number of unique stocks. The columns are:
eValue
This column displays the eigenvalue (variance) of each principal components. Beginning with a variance of 1, each successive component accounts for a decreasing amount of the total variance.
% Var
This column displays the percent of variance for each principal component.
Cum %
This column displays the cumulative percentage of variance for each principal component.
Scree Plot
The Scree Plot displays the eigenvalue for each principal component (by number). Latter components cause the line to become almost flat showing that their contribution is increasingly negligible.
Principal Component Analysis (PCA) allows you to reduce a large number of correlated variables into much fewer synthetic variables. These synthetic variables, which effectively replicate the original data, are referred to as principal components.
Cheers.
