ElliottWave Forecast
September 18, 2023
ElliottWave-Forecast has built its reputation on accurate technical analysis and a winning attitude. By successfully incorporating the Elliott Wave Theory with Market Correlation, Cycles, Proprietary Pivot System, we provide precise forecasts with up-to-date analysis for 50 instruments including FX majors, Gold, Silver, Copper, Oil, Natural Gas, Soybeans, Sugar ,Corn TNX and a number of Equity Indices from around the World. Our clients also have immediate access to our proprietary Actionable Trade Setups, Market Overview, 1 Hour, 4 Hour, Daily & Weekly Wave Counts. Weekend Webinar, Live Screen Sharing Sessions, Daily Technical Videos, Elliott Wave Setup videos, Educational Resources, and 24 Hour chat room where they are provided live updates and given answers to their questions. The guidance of ElliottWave-Forecast gives subscribers the wherewithal to position themselves for proper entry and exit in the Forex marketplace. We believe our disciplined methodology is pivotal for long-term success in trading.

Uranium Miners ETF ($URA) Has Started Next Bullish Cycle

The Global X Uranium ETF ($URA) is an exchange-traded fund (ETF) that seeks to provide investment results that correspond generally to the price and yield performance of the Solactive Global Uranium & Nuclear Components Total Return Index. In this article, we will look at the long term technical outlook using Elliott Wave method.

$URA Elliott Wave Chart Monthly Chart

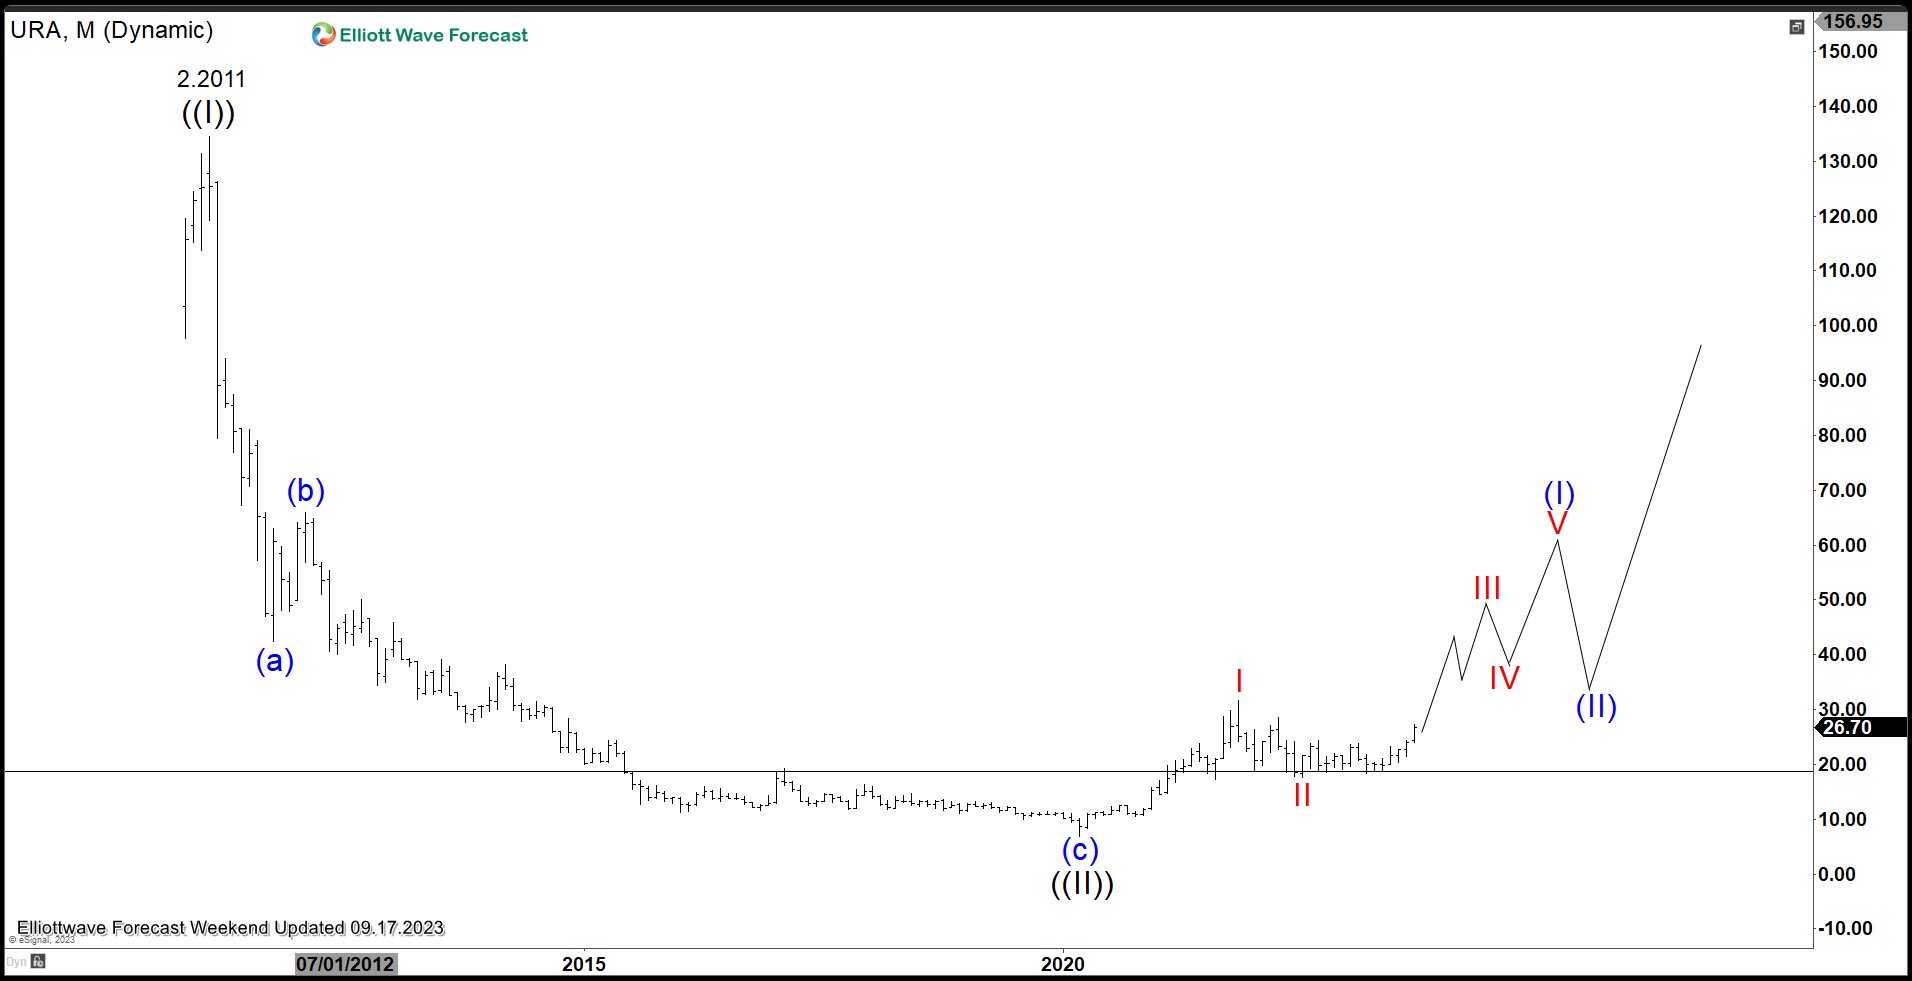
Uranium ETF (URA) Monthly Chart above held up the horizontal support/resistance at $19. The ETF has started to turn higher and should start the next bullish cycle higher. Wave ((II)) ended on March 1, 2020 low at 6.95. Up from there, wave I ended at 31.6 and pullback in wave II ended at 17.65. While pullback stays above 17.65, expect the ETF to continue higher in months and years to come.

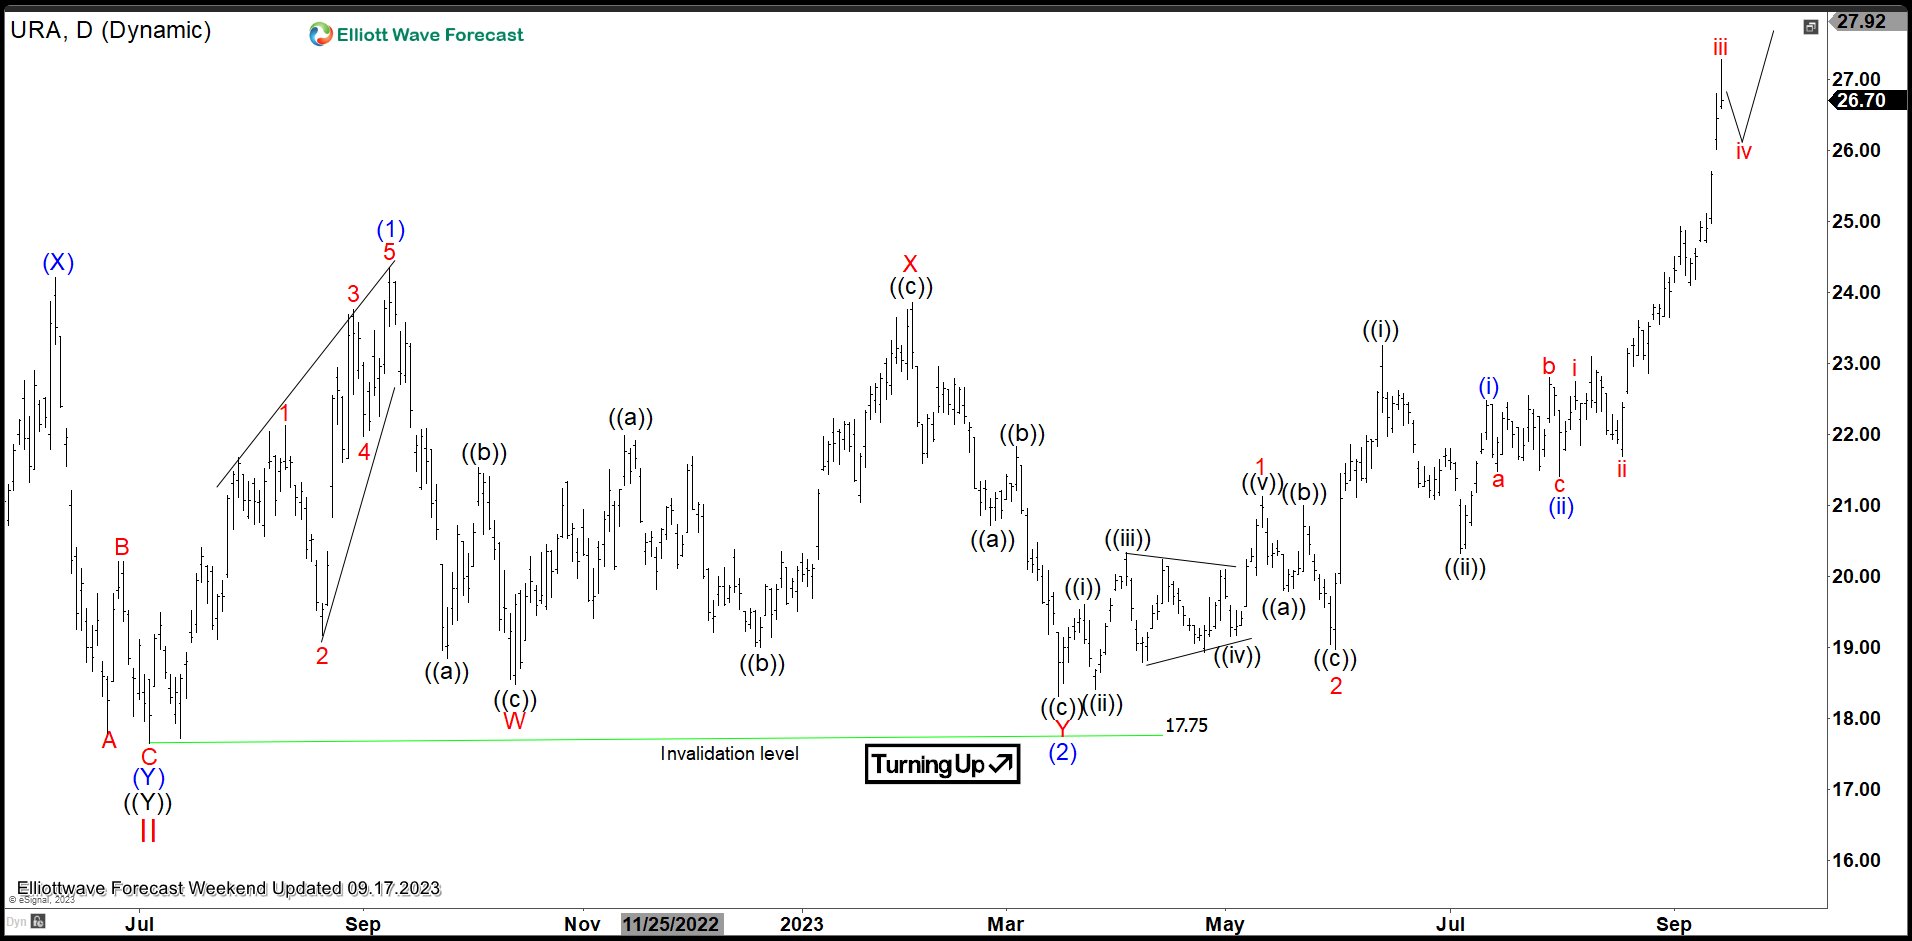
$URA Daily Elliott Wave Chart

After forming major low at 6.95 on March 2020, ETF (URA) rallied in wave (1) towards 24.34. Dips in wave (2) ended at 18.31 as a double three. Down from wave (I), wave W ended at 18.47 and rally in wave X ended at 23.86. The ETF then extended lower in wave Y towards 18.31 which completed wave (2). It has resumed higher in wave (3) with internal subdivision as a 5 waves. Up from wave (2), wave 1 ended at 21.12 and dips in wave 2 ended at 18.97. Expect the ETF to continue to extend higher within wave 3.

Source:  https://elliottwave-forecast.com/stock-market/uranium-miners-etf-ura-started-next-bullish-cycle/ 

More from ElliottWave Forecast