ElliottWave-Forecast has built its reputation on accurate technical analysis and a winning attitude. By successfully incorporating the Elliott Wave Theory with Market Correlation, Cycles, Proprietary Pivot System, we provide precise forecasts with up-to-date analysis for 50 instruments including FX majors, Gold, Silver, Copper, Oil, Natural Gas, Soybeans, Sugar ,Corn TNX and a number of Equity Indices from around the World. Our clients also have immediate access to our proprietary Actionable Trade Setups, Market Overview, 1 Hour, 4 Hour, Daily & Weekly Wave Counts. Weekend Webinar, Live Screen Sharing Sessions, Daily Technical Videos, Elliott Wave Setup videos, Educational Resources, and 24 Hour chat room where they are provided live updates and given answers to their questions. The guidance of ElliottWave-Forecast gives subscribers the wherewithal to position themselves for proper entry and exit in the Forex marketplace. We believe our disciplined methodology is pivotal for long-term success in trading.
Uncertain Recovery: Projections Indicate Continued Decline in Ford's Stock Price
Ford Motor Company (F) is an American multinational automobile manufacturer headquartered in Dearborn, Michigan, United States. It was founded by Henry Ford and incorporated on June 16, 1903. The company sells automobiles and commercial vehicles under the Ford brand, and luxury cars under its Lincoln luxury brand.
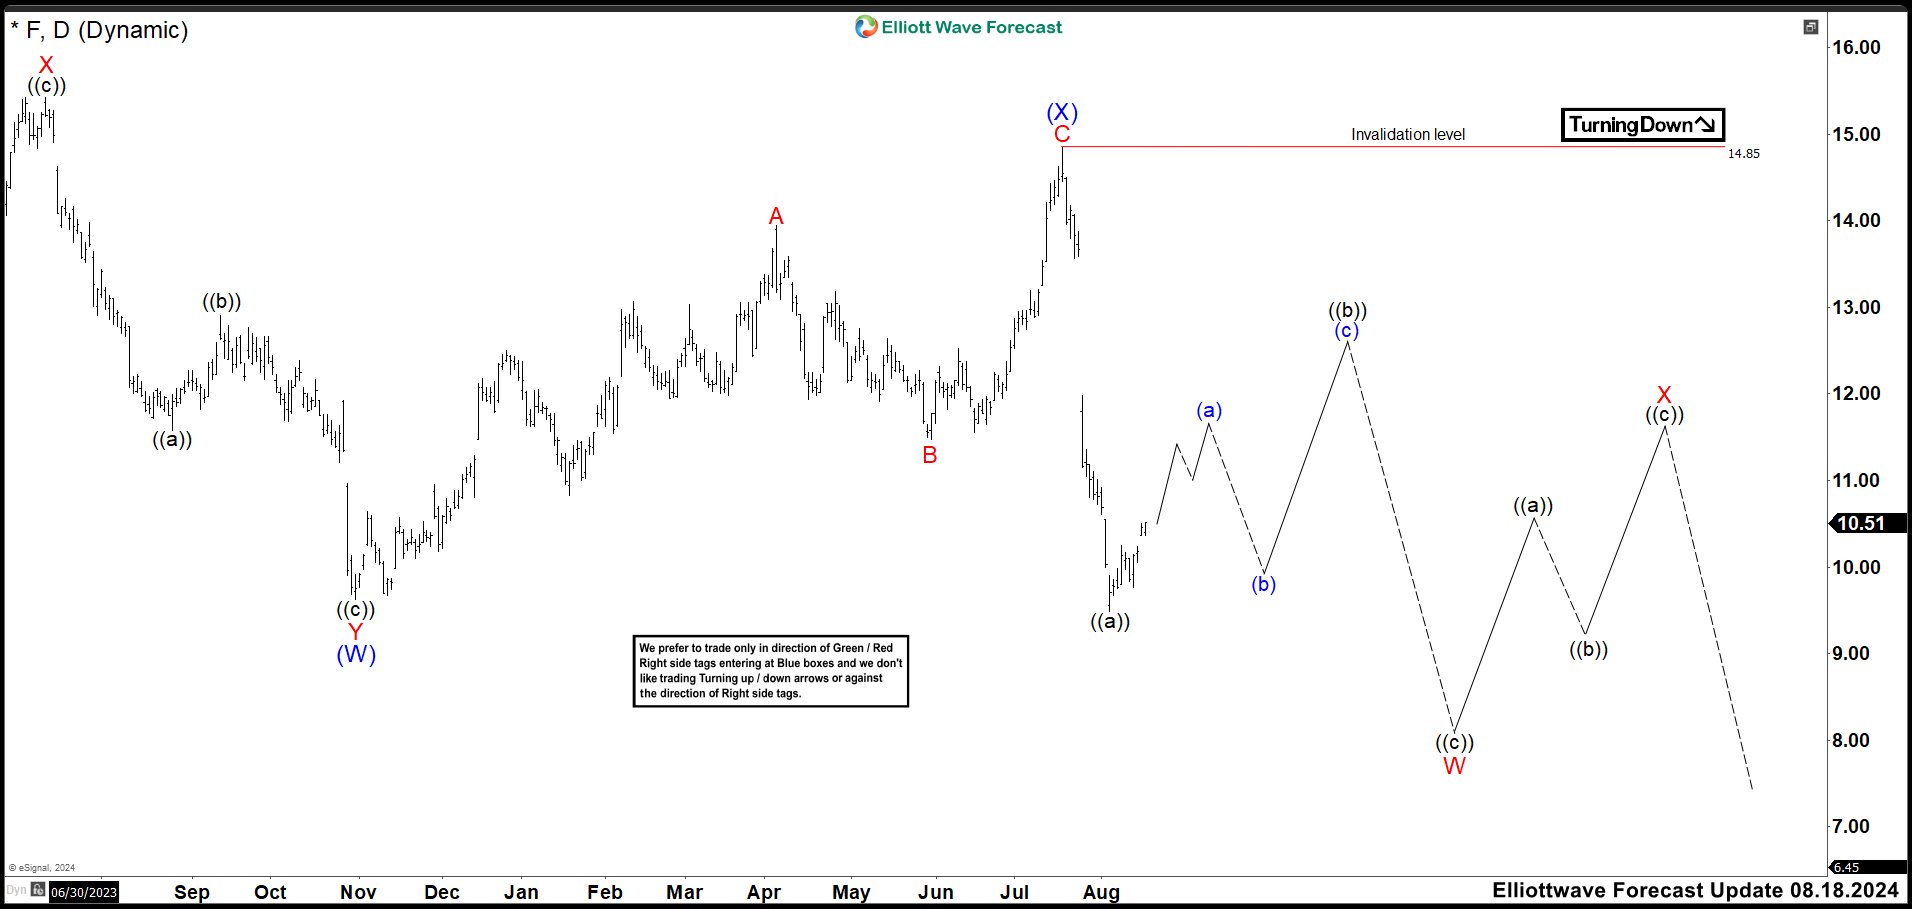
FORD (F) Daily Chart August 2024
We have been calling Ford bearish since it ended a wave ((X)) at 16.68 high. Since then, the market continued lower and we are expecting a double correction (W), (X), (Y) to complete wave ((Y)). Down from August 2022 high, we can see 7 swings lower developing a double correction structure ending wave (W) at 9.63 low. A new rally started from wave (W) low to build a structure of 3 swings as wave (X) ending at 14.85 high.
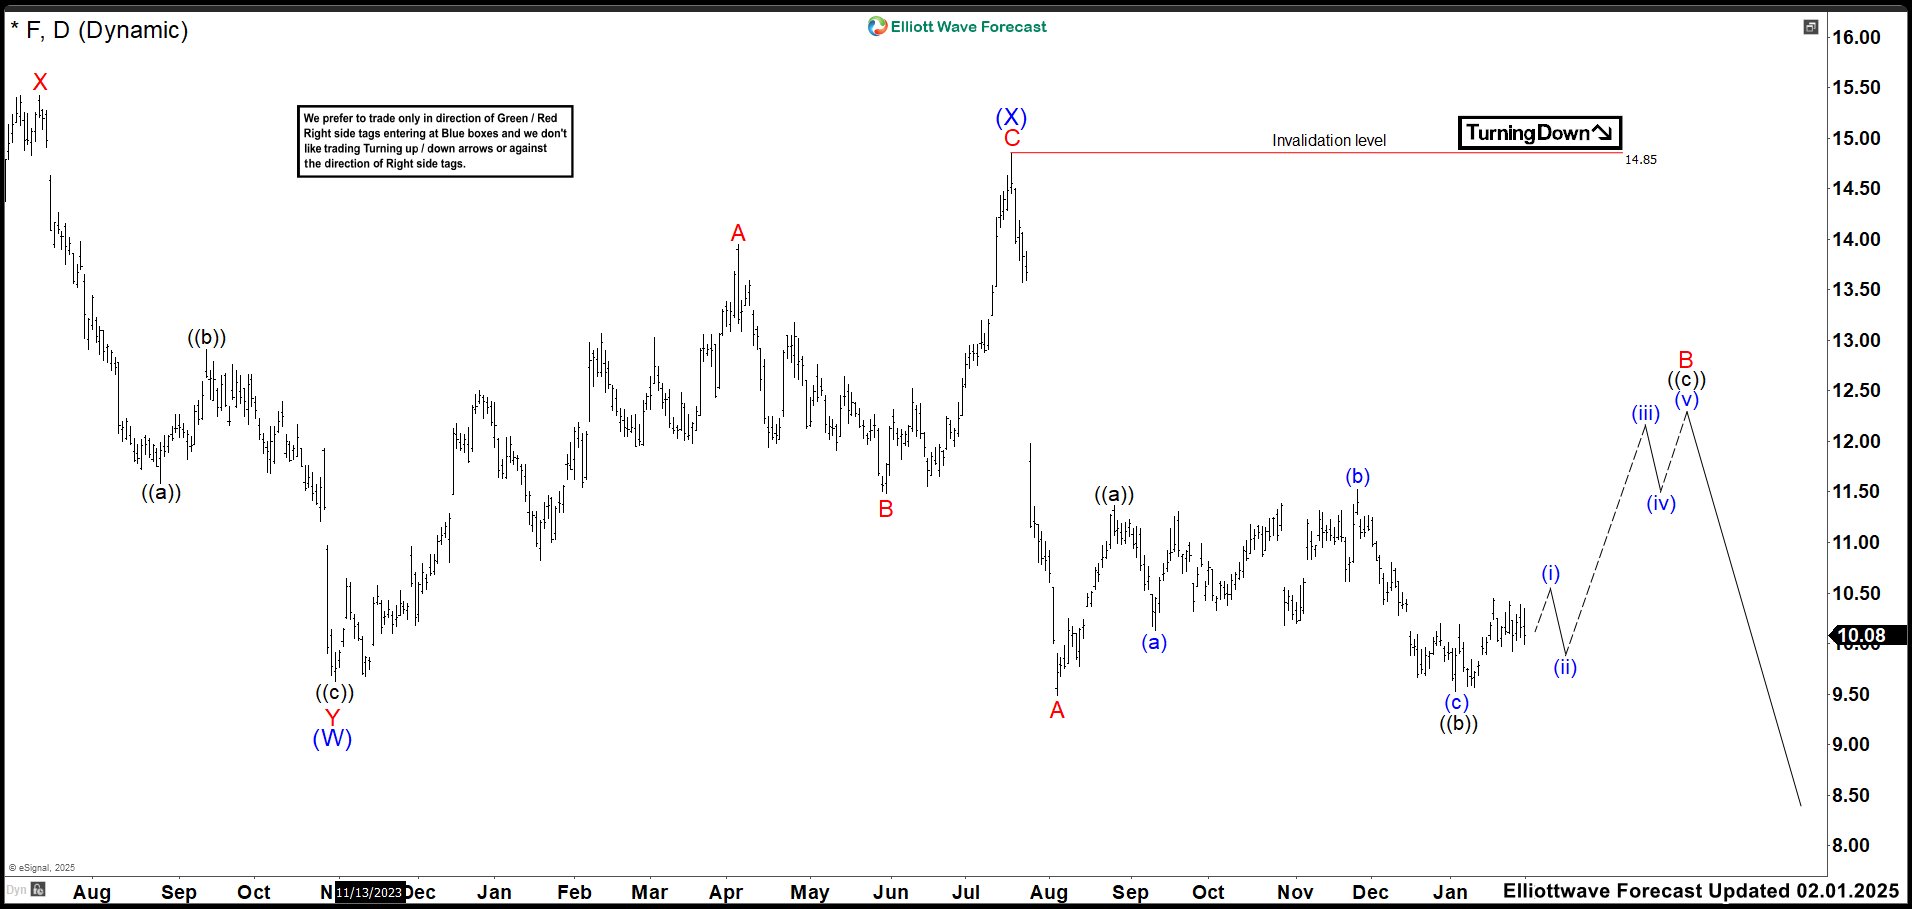
FORD (F) Daily Chart February 2025
After a few days, F opened with a big gap that would eventually break the low of wave (W). This suggested that we should at least see 3 more waves down to finish the bearish cycle. In the last few months, the market has been moving sideways, so we have adjusted the count based on the new structure. Therefore, we have labeled the strong drop from wave (X) as A ending at 9.49 low. The structure formed from here could be a flat correction (3-3-5). For that, we need to see a rally to 11.86 - 12.58 area to complete wave B and then resuming lower in wave C of (Y). We still expect more downside in the stock and it could drop to 7.79 - 3.43 area. We do NOT recommend to buy near term in this possible wave ((c)) of B. The trend is bearish against 14.85 high. Trade smart!
Source: https://elliottwave-forecast.com/stock-market/ford-stock-price-decline/


