Thoughts on the Current Environment 3Q22
3Q 2022 Newsletter
From Ralph Segall, Chief Investment Officer
“If you do not change direction, you might end up where you are heading.”
—Lao Tzu (Chinese Philosopher, ca 6th century BC)
One of the key reasons that common stocks typically comprise the largest portion of our client portfolios is that they provide direct participation in the growth of the global economy. As the economy grows, corporate profits increase, and strong companies are able to both invest in opportunities for new growth and share with their owners (i.e., shareholders) the fruits of their efforts through increased dividends and stock buybacks. As an aside, it’s significant that roughly 40% to 50% 1 of the 9% annualized return stocks have provided over the last 100 years has come from dividends paid out—a factoid that might seem strange to investors accustomed to receiving a dividend yield these days around 1% to 2%.
This is the primary reason we believe in fundamental, bottom-up research as the basis for constructing equity portfolios. While we evaluate numerous financial metrics for each company we research, Return on Invested Capital (ROIC) is the one metric that has proven to be, based on experience, a strong indicator of a company’s long-term return. Historical data shows that the companies that produce the highest ROIC have delivered the best returns for investors over time. Said succinctly, high ROIC companies tend to be the wealth creators in society. 2 Tracking the progress of companies, identifying which are seeing changing dynamics that will cause the ROIC they generate to inflect higher—or, crucially, lower—and doing it well has shown to be a fruitful approach to stock selection.
We begin this essay with the restatement of our bedrock principles of equity investing as they are our true north, particularly during turbulent financial markets like those we find ourselves navigating today. The “science” of portfolio construction may lie in the analysis we do on individual securities, but the “art” of the effort is to determine the appropriate valuation to put on the companies we are considering. Volatility across markets is often the result of a regime change in monetary or fiscal policy, leading to the reconsideration of value across financial assets. Individual investors find this volatility to be very unsettling. As professional investors, we find that volatility creates and uncovers investment opportunities on which we can capitalize. We do so by adhering to our bedrock principles and investment discipline.
In the last edition of Thoughts on the Current Environment , we laid out our case for thinking such a regime change was underway. The lack of restraint by the central banks of the world, chief among them being the Federal Reserve system here in the U.S. (Fed), to print money at an excessive rate has finally encountered a countervailing force: inflation. The rapid rise of inflationary pressure, first thought to be pandemic-related and temporary, seems more durable and has finally caused policy makers to change their profligate ways. As far as financial assets are concerned, we argued that the prices of stocks and bonds had risen to valuation levels that could not be justified without assuming that prices, however unanchored to the realities of economics, could just keep on rising indefinitely. As a result of reduced monetary stimulus, or perhaps alongside of it, economic (and thus profit) growth is moving to a lower trajectory. As we stated, slower population growth around the world, and smaller gains in productivity are likely to keep profit margins under pressure. Rising interest rates that result from Fed tightening will also cut into corporate profits.
We also suggested that the affairs of the day—the war in Ukraine, supply chain disruptions, new variants of COVID, unconstrained increases in inflation, political turmoil in much of the world—were all factors that could accelerate or delay the arrival of the new financial asset order. As it happens, they have hastened the revaluation of financial assets, as the returns in the second quarter very amply demonstrate. In this construct, whether we are at “peak inflation” or not is really not an issue. Profit growth is likely to be subdued for the intermediate term, whether that growth slows quickly or in a more gradual fashion. Similarly, debate over whether the markets of the last two or three years represent a “super-bubble” or not will be of more interest to economic historians than to us. That profits may be much weaker than current forecasts suggest is not a consensus, this despite warnings by companies such as Target and Microsoft. As you know, we don’t pay much attention to consensus anyway, often using it as a counter signal to our own actions.
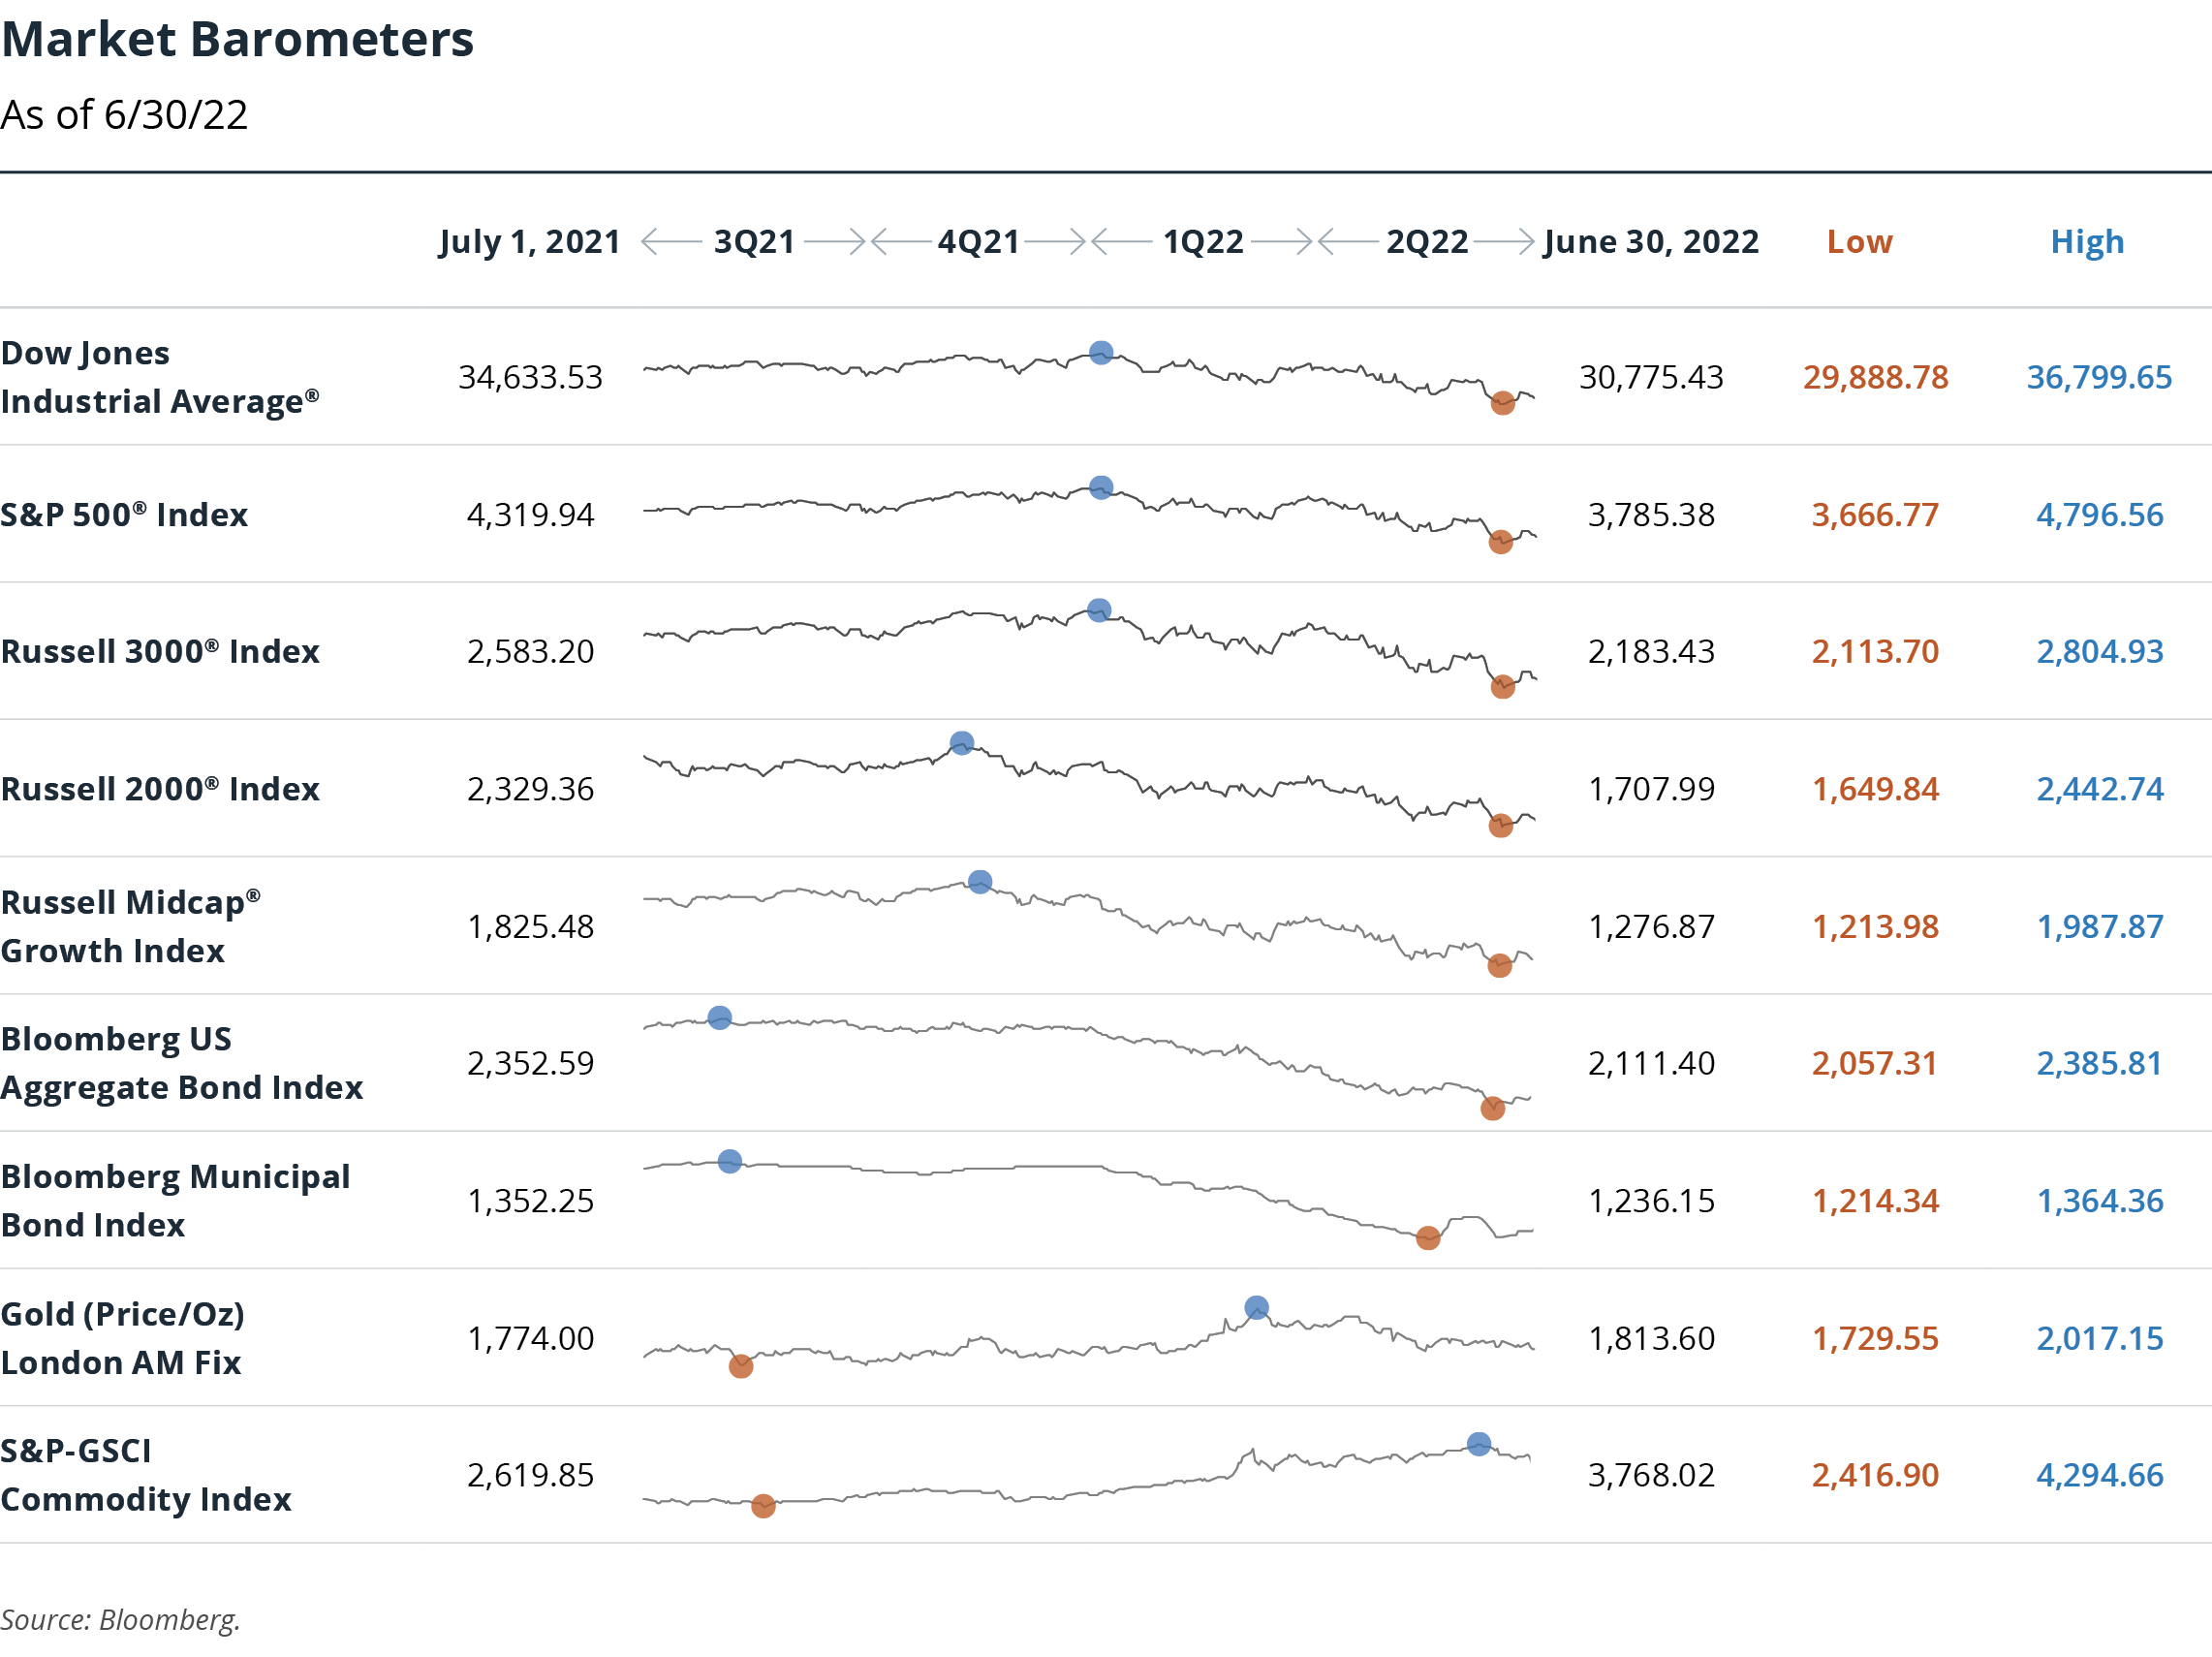
We remain in the mindset that this is a time to protect capital rather than to aggressively seek to grow it. Does protecting capital mean engaging in wholesale selling of stocks (or bonds, for that matter)? In short, we think not. It does mean understanding that trying to find a bottom by bargain hunting in some of the asset categories that have been hit the hardest is not necessarily the right action either. Below is a table of the casualties of the onset of the bear market (measured from the market’s peak on January 4 of this year). Perhaps a trigger warning is required for those who quail at the sight of big losses in value.
An End of a Speculative Era: Regime Change Imposes Reality into Valuations
December 2021 – June 2022
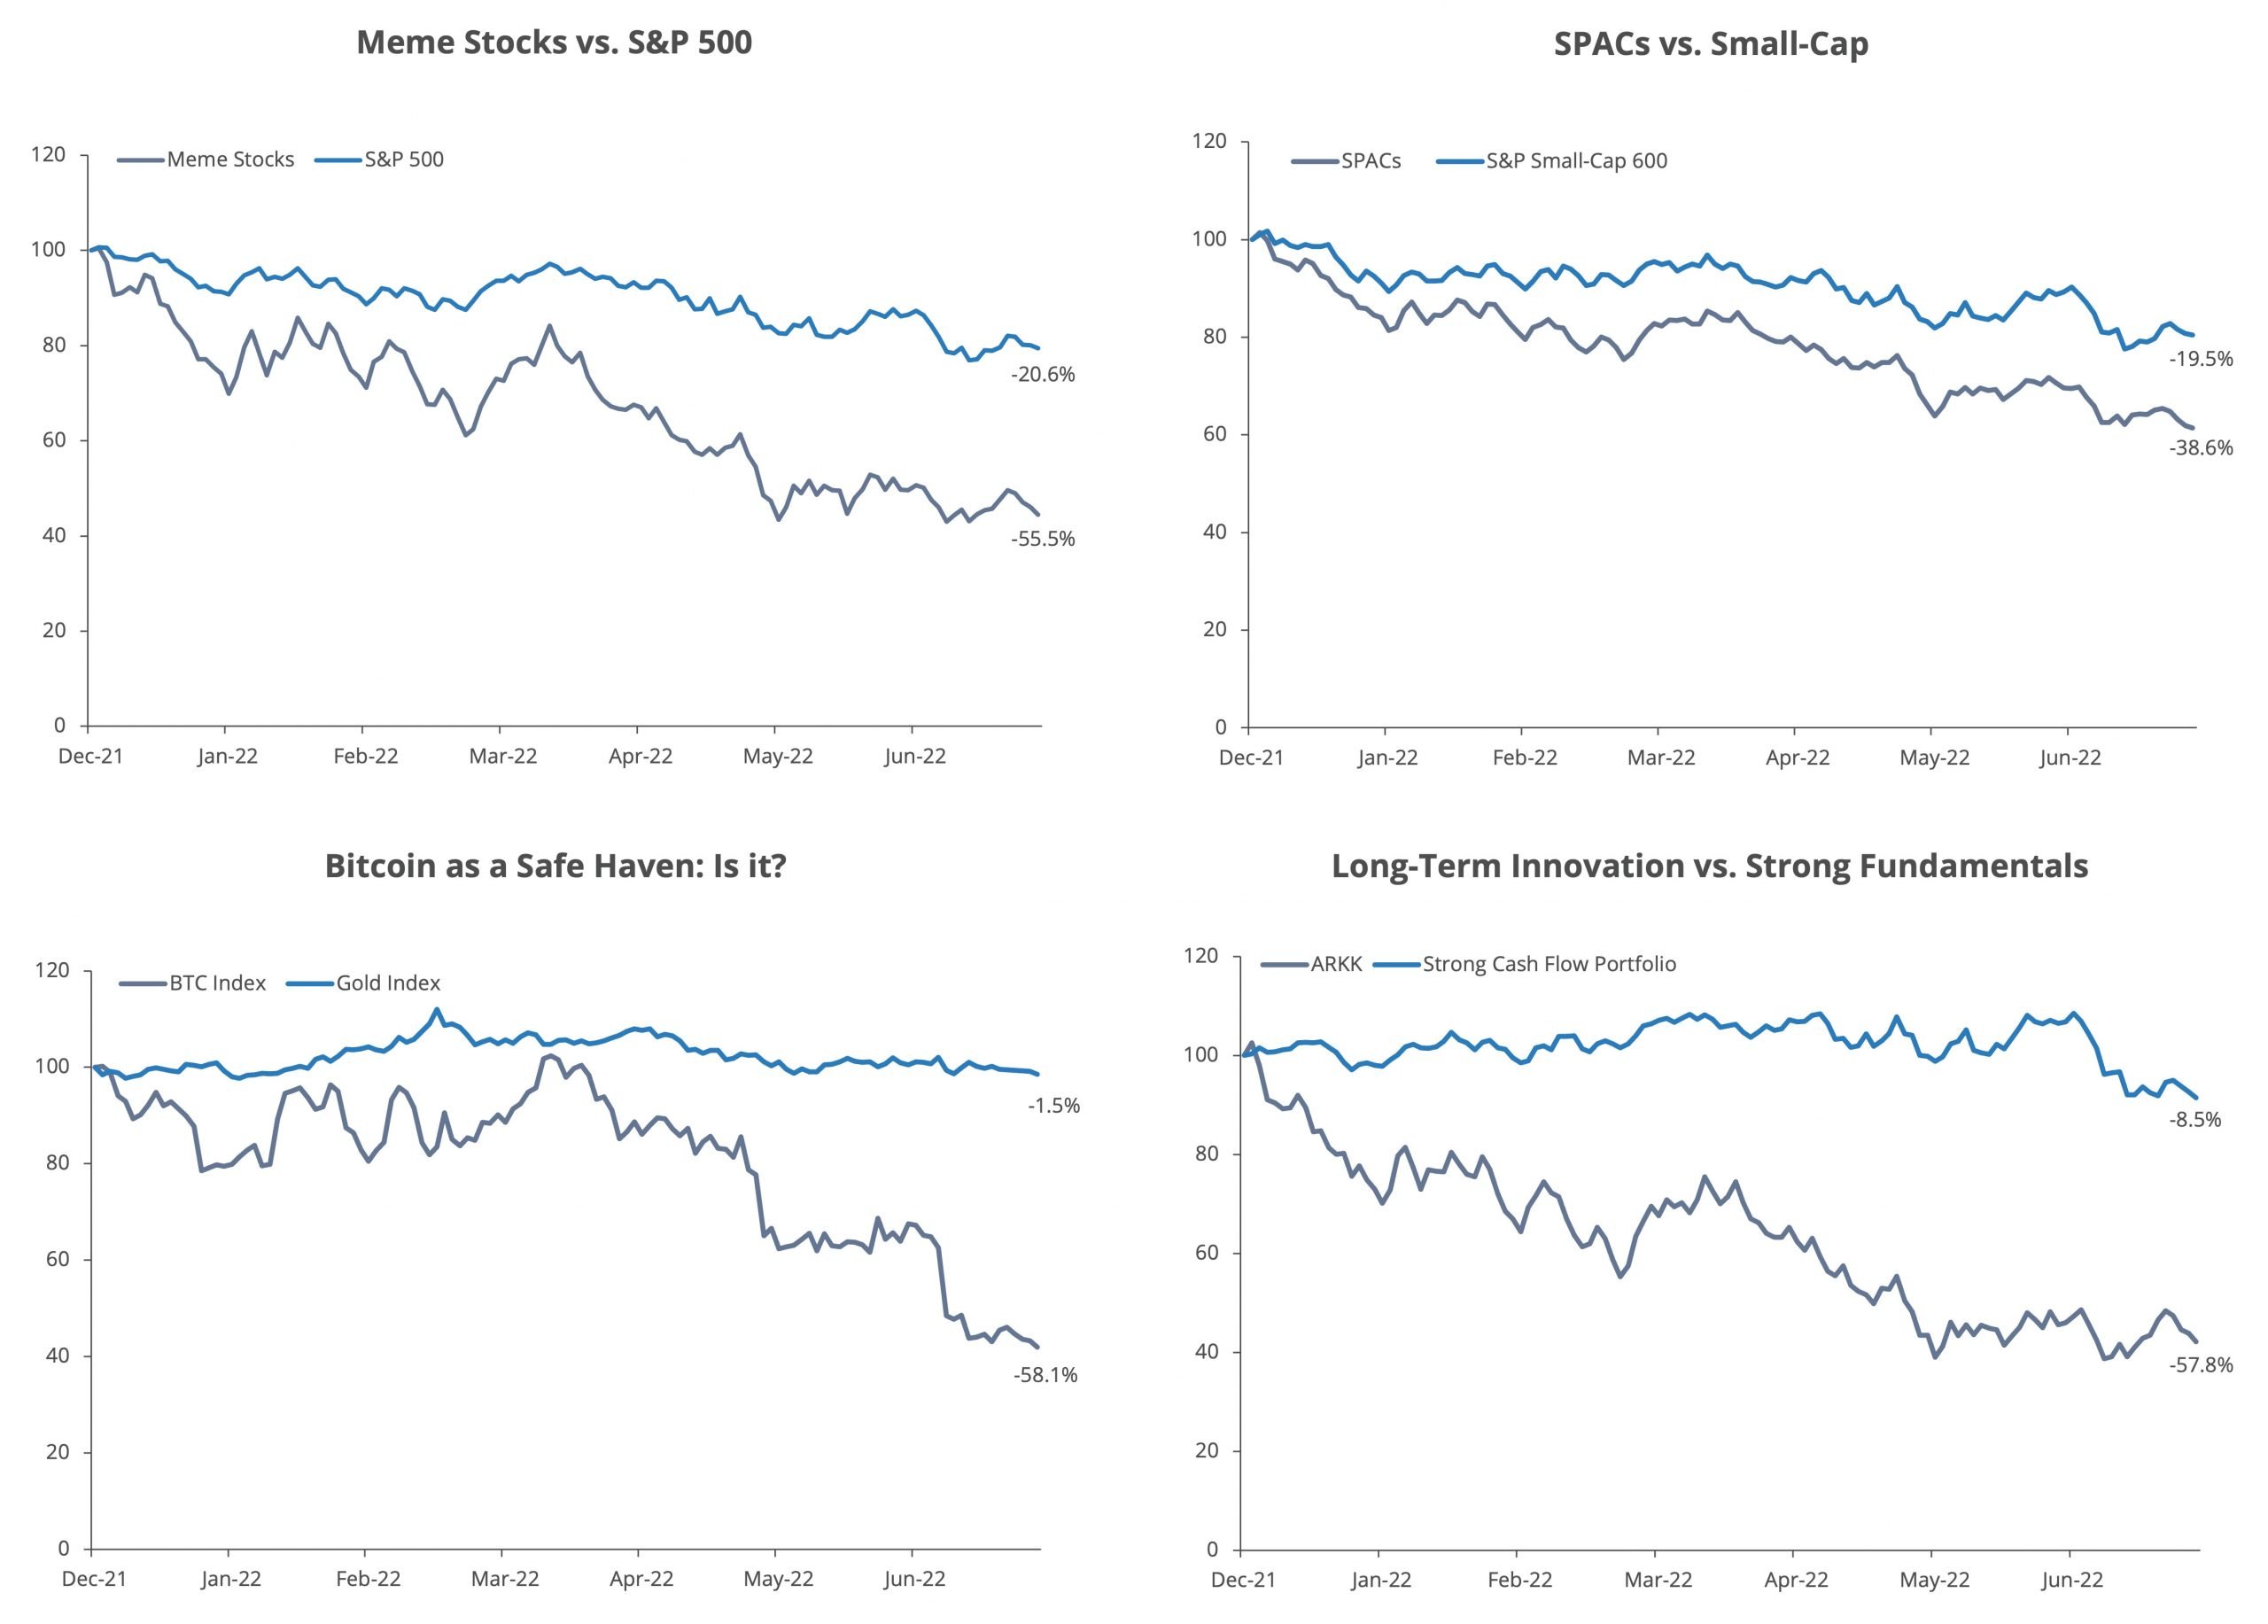
Source: FactSet. The values are indexed to 12/31/2021. This means that the price on 12/31/2021 is 100 and any deviation from there is shown in each chart. Data for the Meme stocks is based on ETF ticker MEME-US. Data for SPACs is represented by ETF ticker SPAK-US. The BTC Index is the price of Bitcoin indexed to 100 at 12/31/2021. ARKK is an ETF that (by its own definition) invests in “cutting-edge firms” that adhere to the advisor’s definition of “disruptive innovation”. In other words, we view these as high growth, speculative securities. The strong cash flow portfolio is represented by ETF ticker COWZ-US, which focuses on companies that have strong, positive free cash flows. Past performance is not an indicator of future results.
Whether these companies will recoup these losses in value does not turn on the amount of loss they have sustained to date. That would assume the earlier peak valuations had been warranted by the underlying economics, as opposed to the enthusiasm of buyers with too much time, money, and speculative fever on their hands.
In time, inflation will abate. As the old maxim says, “The best cure for high prices is high prices.” Prices, after all, are a signal. They tell producers to bring more of what they sell to market, and they also influence buyers to consider cutting back or finding alternatives. It is instructive to note that for many commodities that have active futures markets, the prices several years forward are substantially lower than current (“spot”) prices today. Prices today reflect immediate shortages here and now. Such problems usually get fixed in fairly short order.
And in due course, interest rates will stabilize. How much higher and when is beyond the abilities of any forecaster, including your correspondent, to predict. Long-term interest rates tend to anchor in and around long-term real growth rates plus a premium for long-term inflation rates. As we think that global growth is in for a period of slow real growth, any fear of returning to the double-digit interest rates of the 1980s is likely misplaced.
The combination of stability in the economy and of interest rates levels will allow stock market participants to get back to estimating how much of a premium over interest rates they think they are due for the risk of investing in stocks. Which will bring us back to the place this essay began: Which stocks should an investor buy? And why? That is where we focus vast amounts of time, energy, and effort. If we keep doing what we have done for the last 27 years on behalf of our clients, we believe they should find their capital relatively well protected compared to the broad market and ready to resume compounding again, when that time comes.