ElliottWave-Forecast has built its reputation on accurate technical analysis and a winning attitude. By successfully incorporating the Elliott Wave Theory with Market Correlation, Cycles, Proprietary Pivot System, we provide precise forecasts with up-to-date analysis for 50 instruments including FX majors, Gold, Silver, Copper, Oil, Natural Gas, Soybeans, Sugar ,Corn TNX and a number of Equity Indices from around the World. Our clients also have immediate access to our proprietary Actionable Trade Setups, Market Overview, 1 Hour, 4 Hour, Daily & Weekly Wave Counts. Weekend Webinar, Live Screen Sharing Sessions, Daily Technical Videos, Elliott Wave Setup videos, Educational Resources, and 24 Hour chat room where they are provided live updates and given answers to their questions. The guidance of ElliottWave-Forecast gives subscribers the wherewithal to position themselves for proper entry and exit in the Forex marketplace. We believe our disciplined methodology is pivotal for long-term success in trading.
The Elliott Wave Analysis For Lululemon Athletica (NASDAQ: LULU) On Different Timeframes
The Elliott Wave analysis for Lululemon Athletica (NASDAQ: LULU) provides a detailed examination of its ongoing corrective structure within a larger five-wave impulsive sequence.
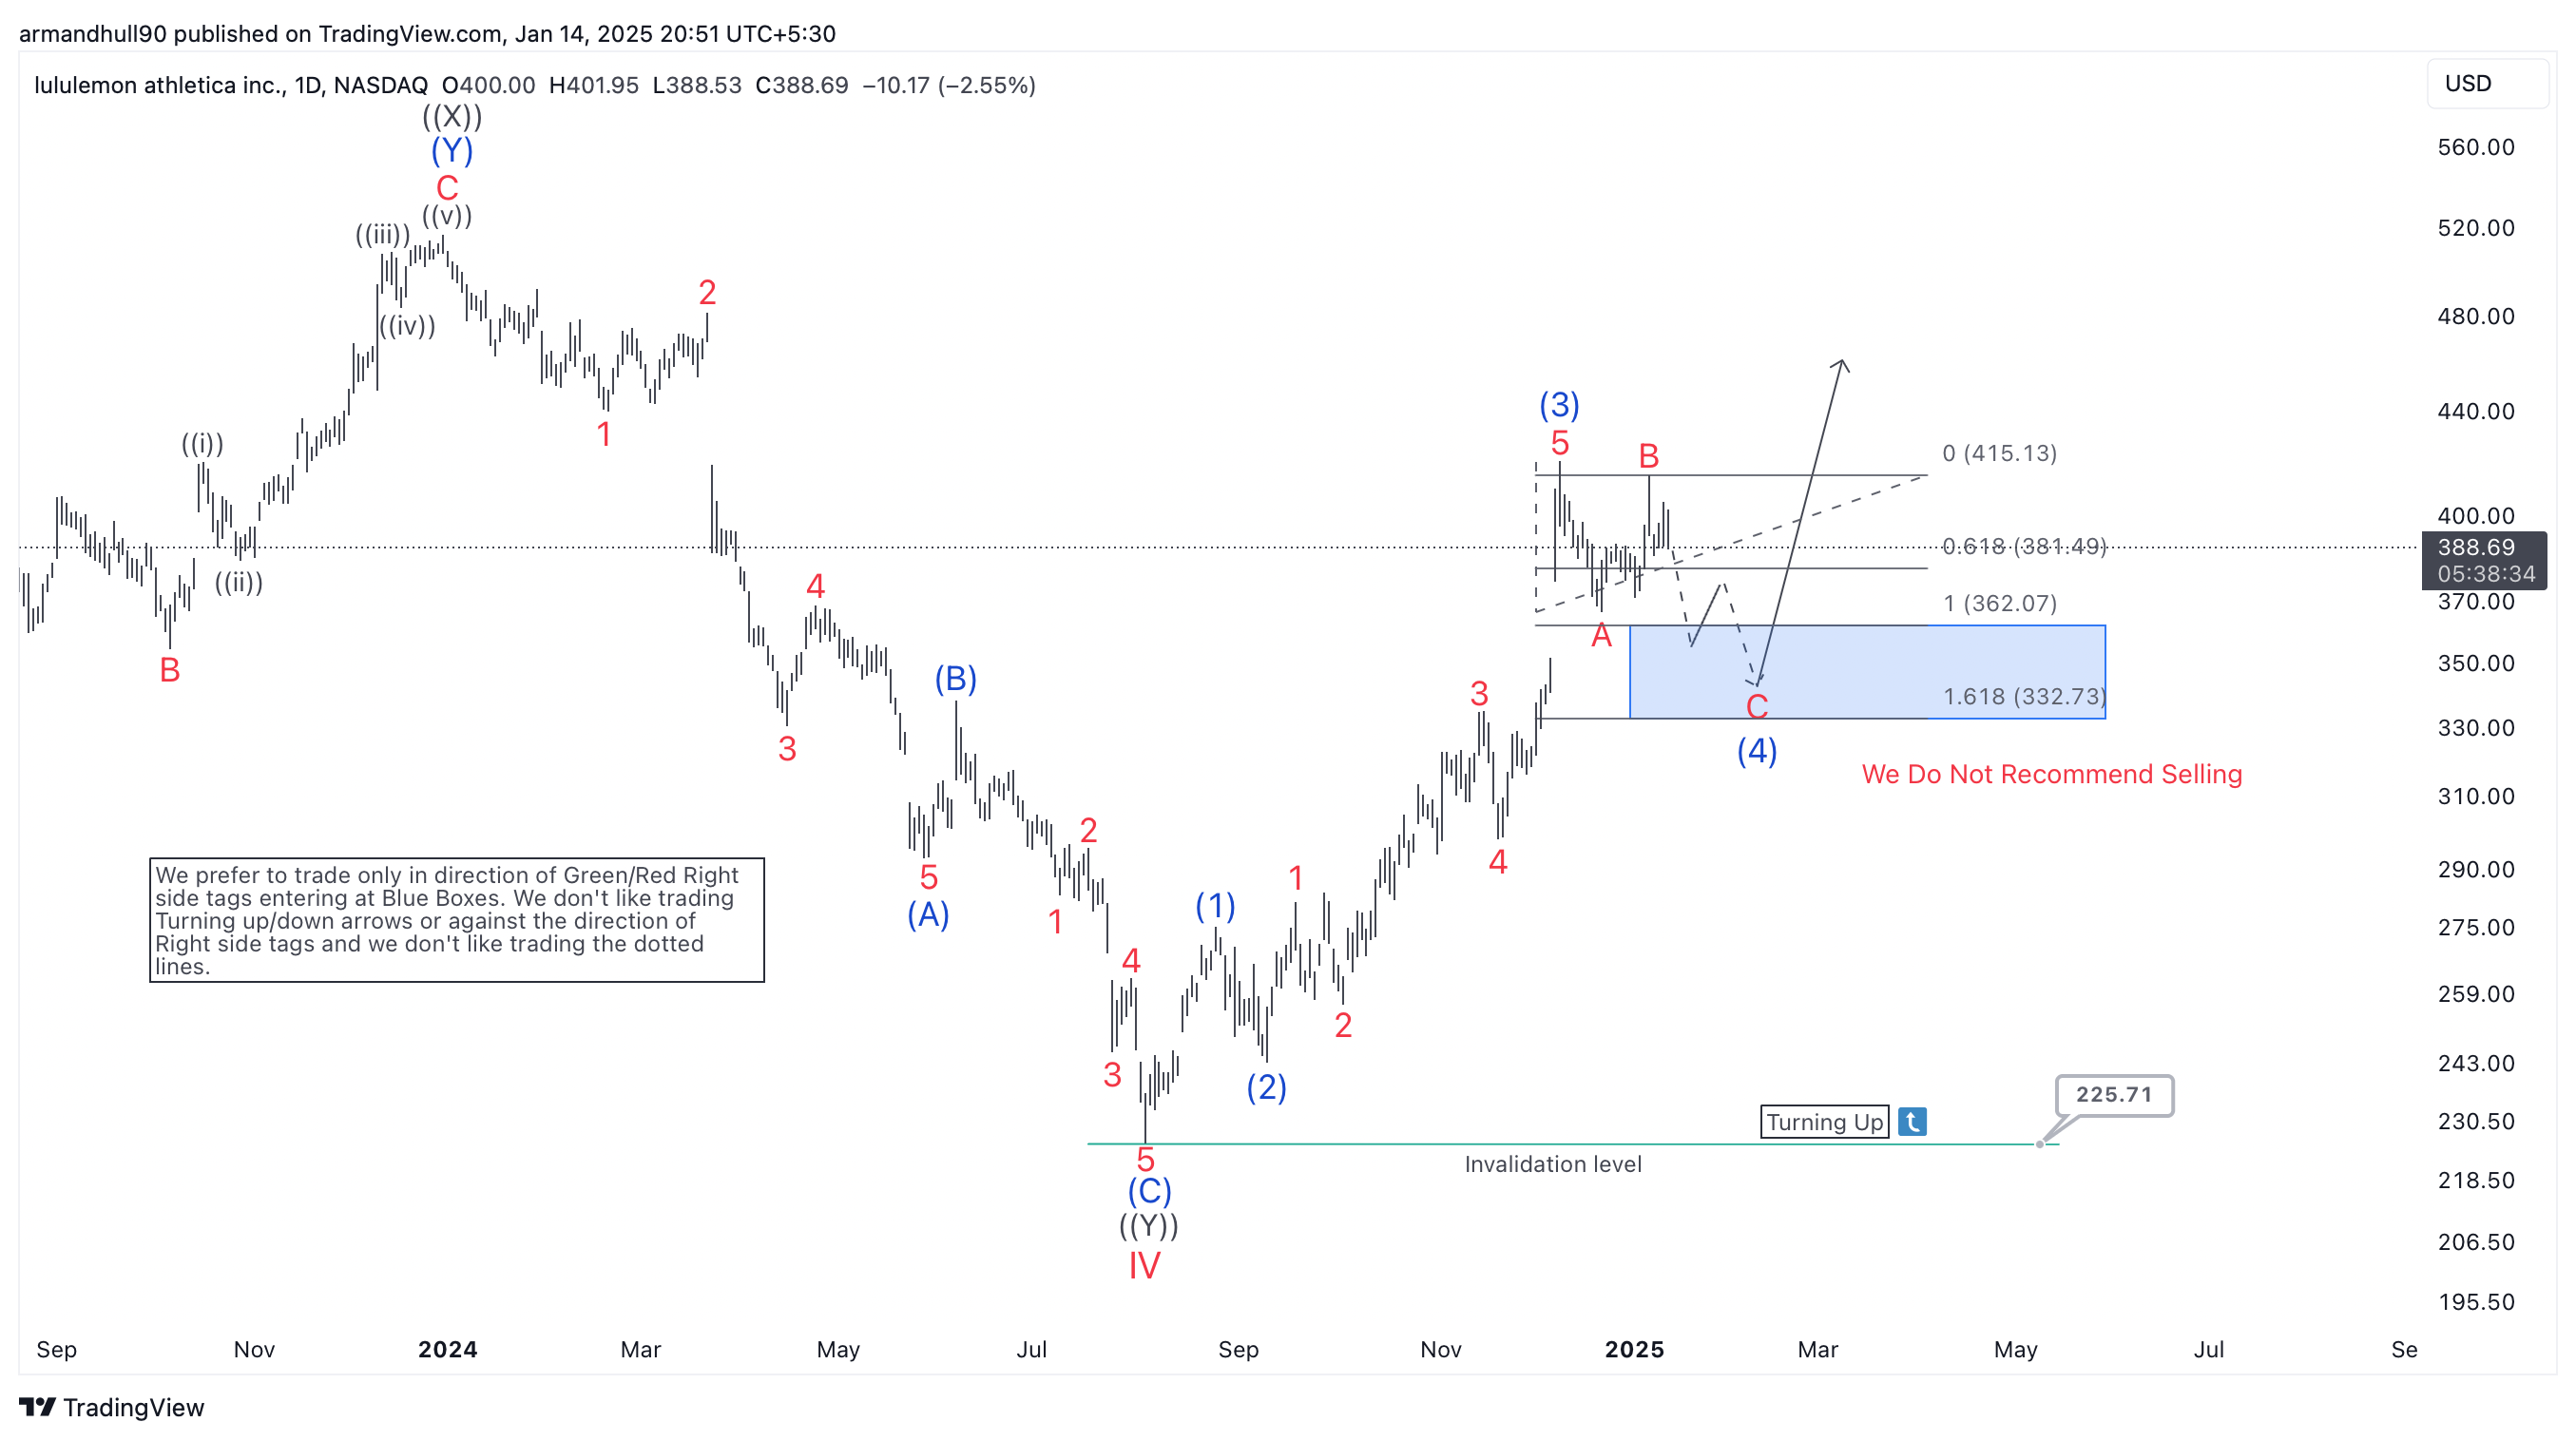
Daily Elliott Wave Counts:
On the daily chart, the stock remains in wave (4), a corrective phase within a larger impulsive trend. Wave (4) appears to follow an ABC zigzag pattern. Wave A has already ended as a five-wave decline. Meanwhile, wave B is still developing. It might take the form of a flat or expanded flat correction with three distinct waves.
Once wave B completes, wave C is likely to move downward. It could reach the Fibonacci extension zone between 1.0 ($361.72) and 1.618 ($332.38). This area corresponds with the "blue box," a key high-probability reversal zone. The blue box signals where wave (4) might end, offering a potential entry for the bullish wave (5). The invalidation level is positioned below $225.71, ensuring a clear boundary for risk management.
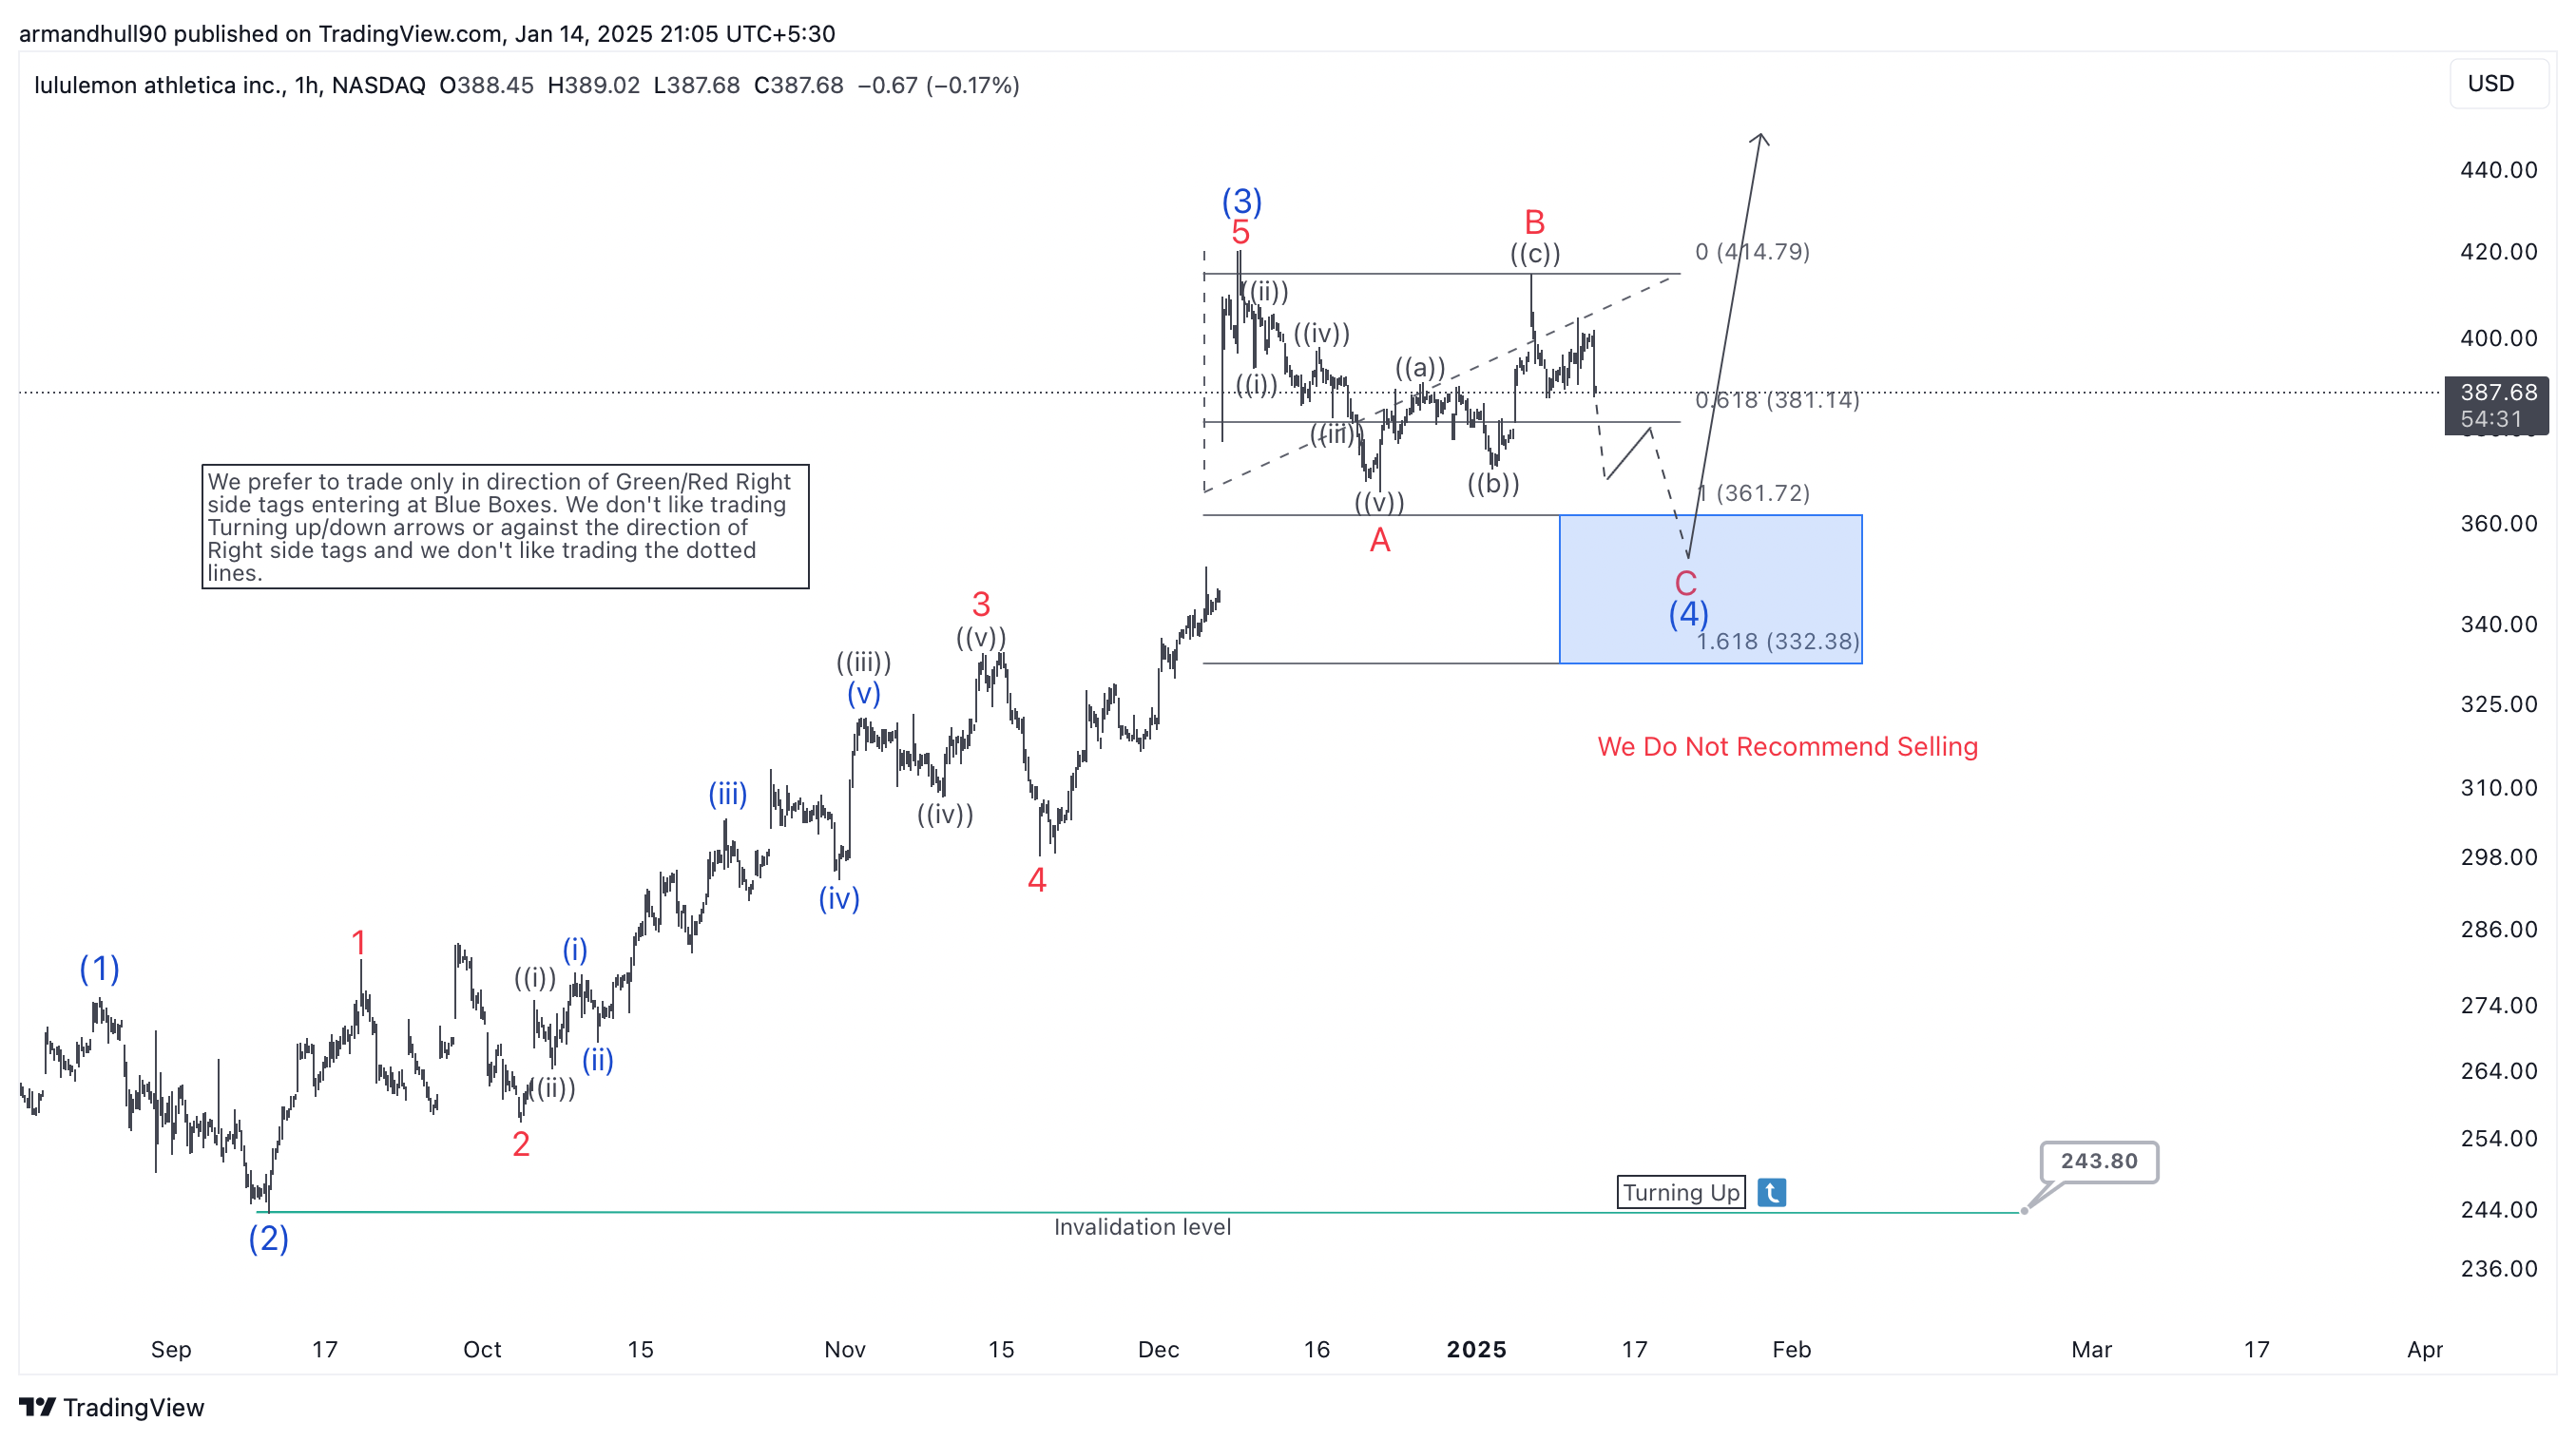
Hourly Counts: Short-term Outlook
On the hourly chart, wave (4) reveals crucial details, especially the structure of wave B. This wave is developing as a complex correction, likely a flat or double zigzag. Wave A already ended with a clear five-wave decline. Meanwhile, wave B is unfolding in a three-wave corrective pattern.Next, wave C is expected to complete as a five-wave decline. It will likely reach the blue box between $361.72 and $332.38. This area acts as a strong support zone and provides a high-probability reversal point. If the price reverses here, wave (5) could begin. This upward move may surpass the wave (3) high of $415.13, offering significant bullish potential.
Moreover, the analysis highlights the importance of trading in the direction of green right-side tags. These tags indicate favorable trends. Traders should avoid speculative positions, such as shorting in the blue box or relying on dotted-line projections. When wave (5) materialises as expected, it will likely confirm the Elliott Wave analysis and unlock further upside potential.
Source: https://elliottwave-forecast.com/stock-market/elliott-wave-analysis-lululemon-athletica-nasdaq-lulu-different-timeframes/


