Sugar: Double Zigzag Elliott Wave Structure
Many Elliott wave practitioners call every WXY structure a double zigzag structure when in reality, every WXY structure is not a double zigzag structure. In this blog, we explain the difference between a double zigzag Elliott wave structure and a double three Elliott wave structure and take a look at a double zigzag structure which is unfolding in the market right now.
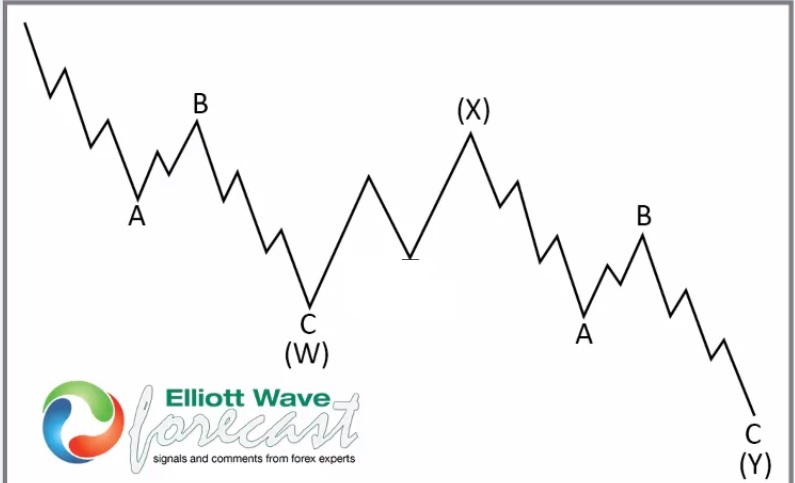
Double Zigzag Elliott Wave Structure
Image below is that of a double Zigzag Elliott Wave Structure. Wave (W) is a zigzag in which both A and C are in 5 waves. Same is the case with wave (Y) and again both A and C are in 5 waves and that's why it qualifies as a double zigzag Elliott wave structure. Now, wave (W) can consist of any corrective structure, it could consist of a lesser degree W-X-Y and same with wave Y and if that's the case, then it would be called a double three Elliott Wave structure. Thus, to conclude we could say that every double zigzag structure is a double three structure but every double three structure is not a double zigzag.
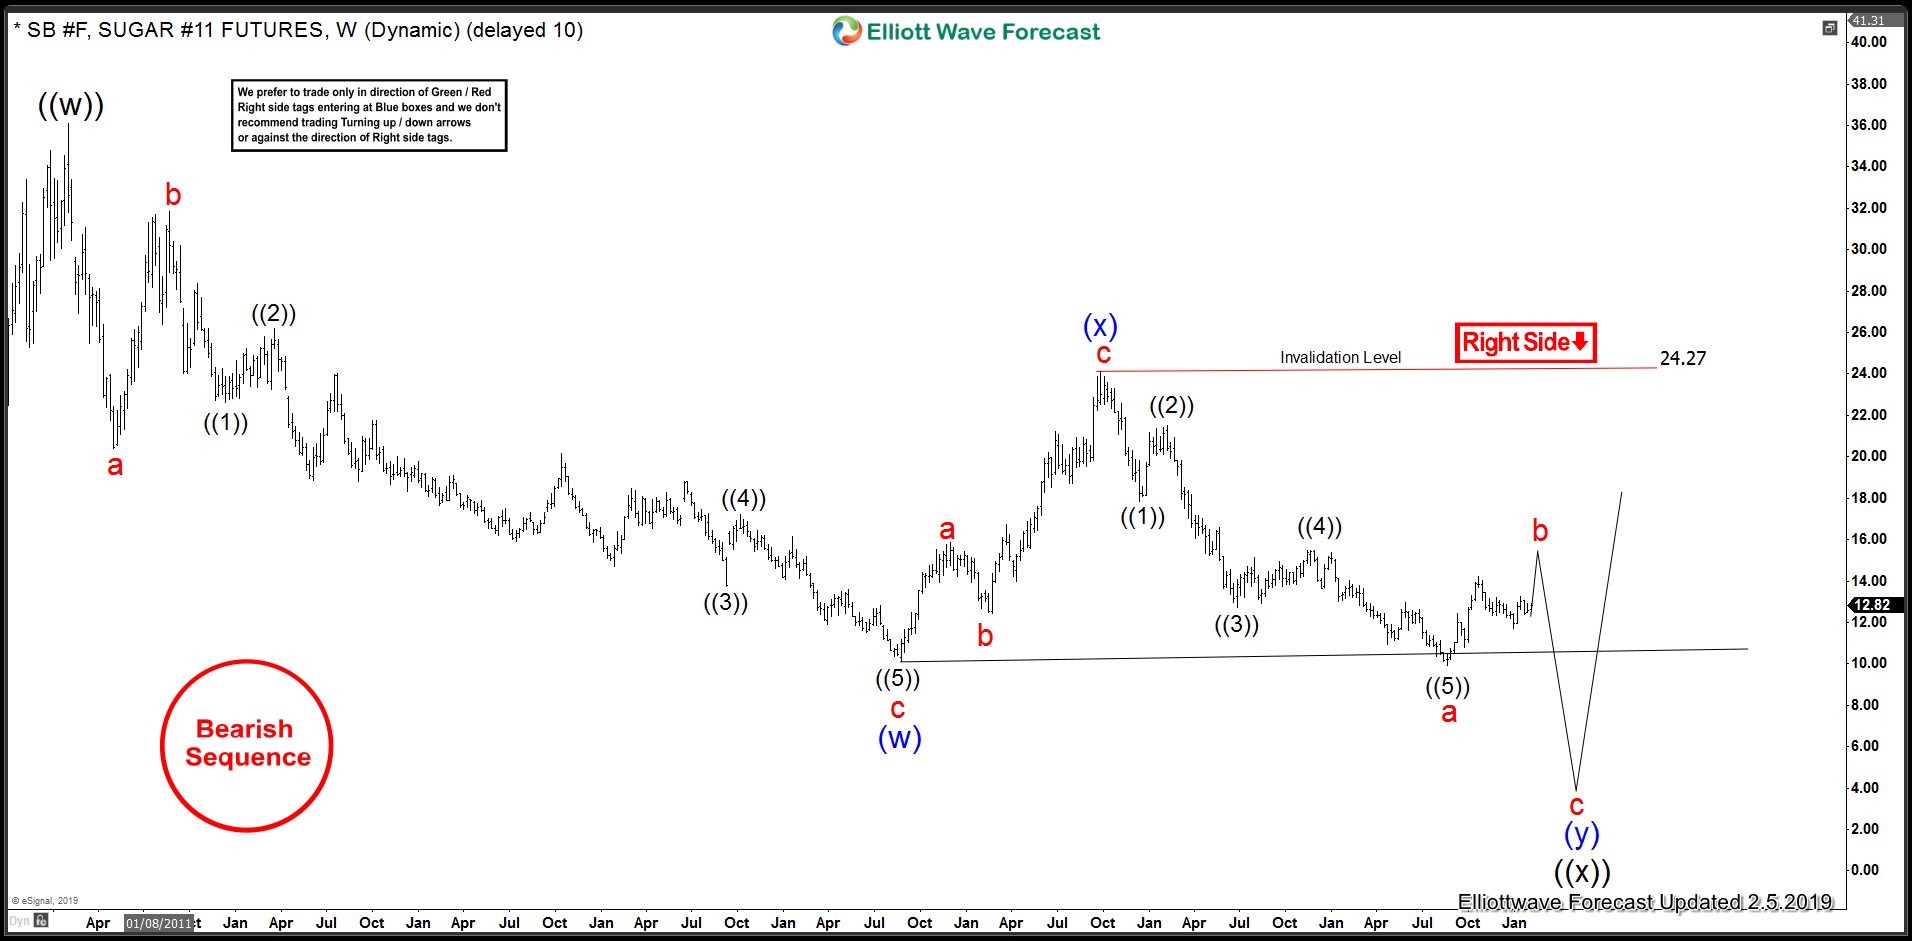
SB_F Sugar Elliott Wave Analysis: Weekly Chart
Below is the weekly chart of Sugar Futures which shows 5 swings a zigzag drop from $36.08 down to $10.13 followed by a 3 waves bounce to $24.27. After this, Sugar futures dropped below $10.13 in 5 waves and started bouncing. Cycle from $24.27 low ended at $9.91 and Sugar is now in a bounce to correct the decline from $24.27 peak. As bounces fail below $24.27 high, Elliott wave sequence calls for Sugar futures to make another swing lower below $9.91 to complete 7 swings or a double zigzag structure lower from $36.08 peak.