SPX : Elliott Wave Forecasting the Future Path
Hello traders ! In this technical article, we’re going to take a quick look at the Elliott Wave charts of the SPX index, published in the members area of the website. As our members know, SPX remains overall bullish, currently correcting the cycle from the August 5118.95 low. In this article, we will explain the forecast and the best way to trade SPX.
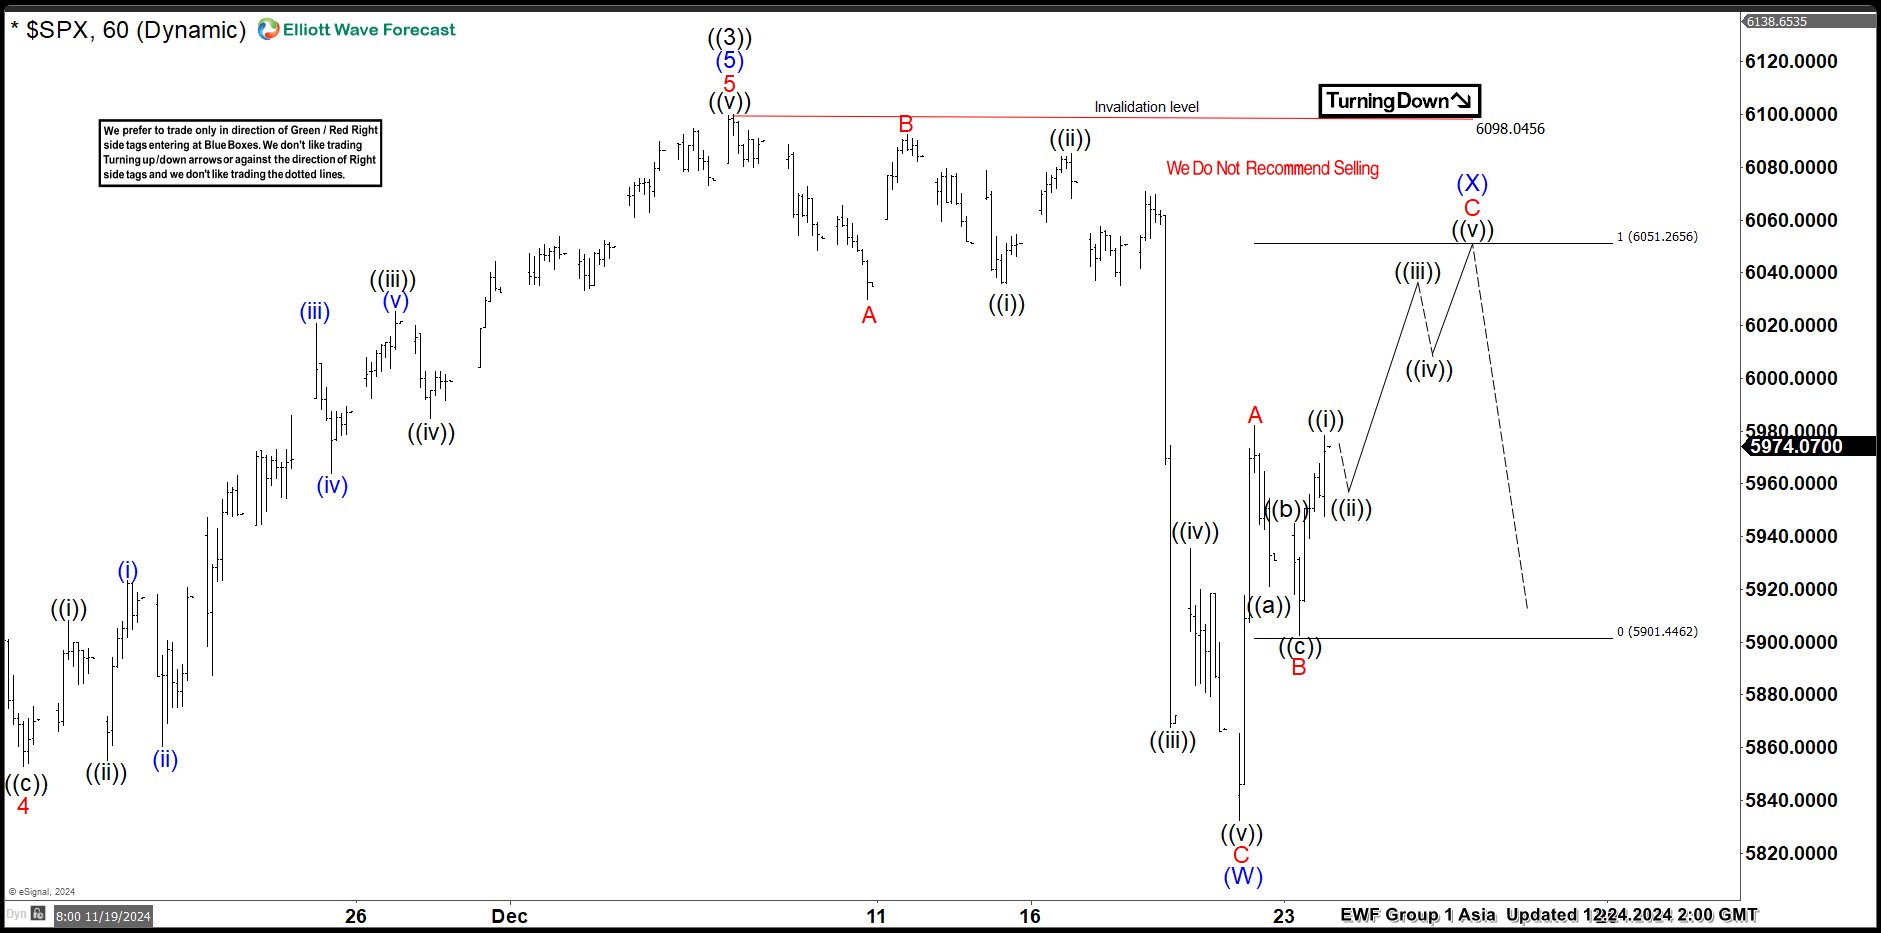
SPX H1 Update 12.24.2024
The index is bouncing against the 6098.045 high, and currently the recovery appears incomplete at the moment. We’ve seen a sharp rally from the lows, which looks impulsive. The current view suggests another leg up toward the 6051.2 area to complete a 3-wave bounce in the (X) blue recovery. From there, we could see another leg down in the (Y) blue wave to complete the 4-hour pullback against the August 5118.9 low. As our members know, we favor the long side in indices and do not recommend selling during any proposed pullbacks. If we see the proposed leg down, we will use it as a new buying opportunity.
Reminder : You can learn more about Elliott Wave Patterns at our Free Elliott Wave Educational Web Page .
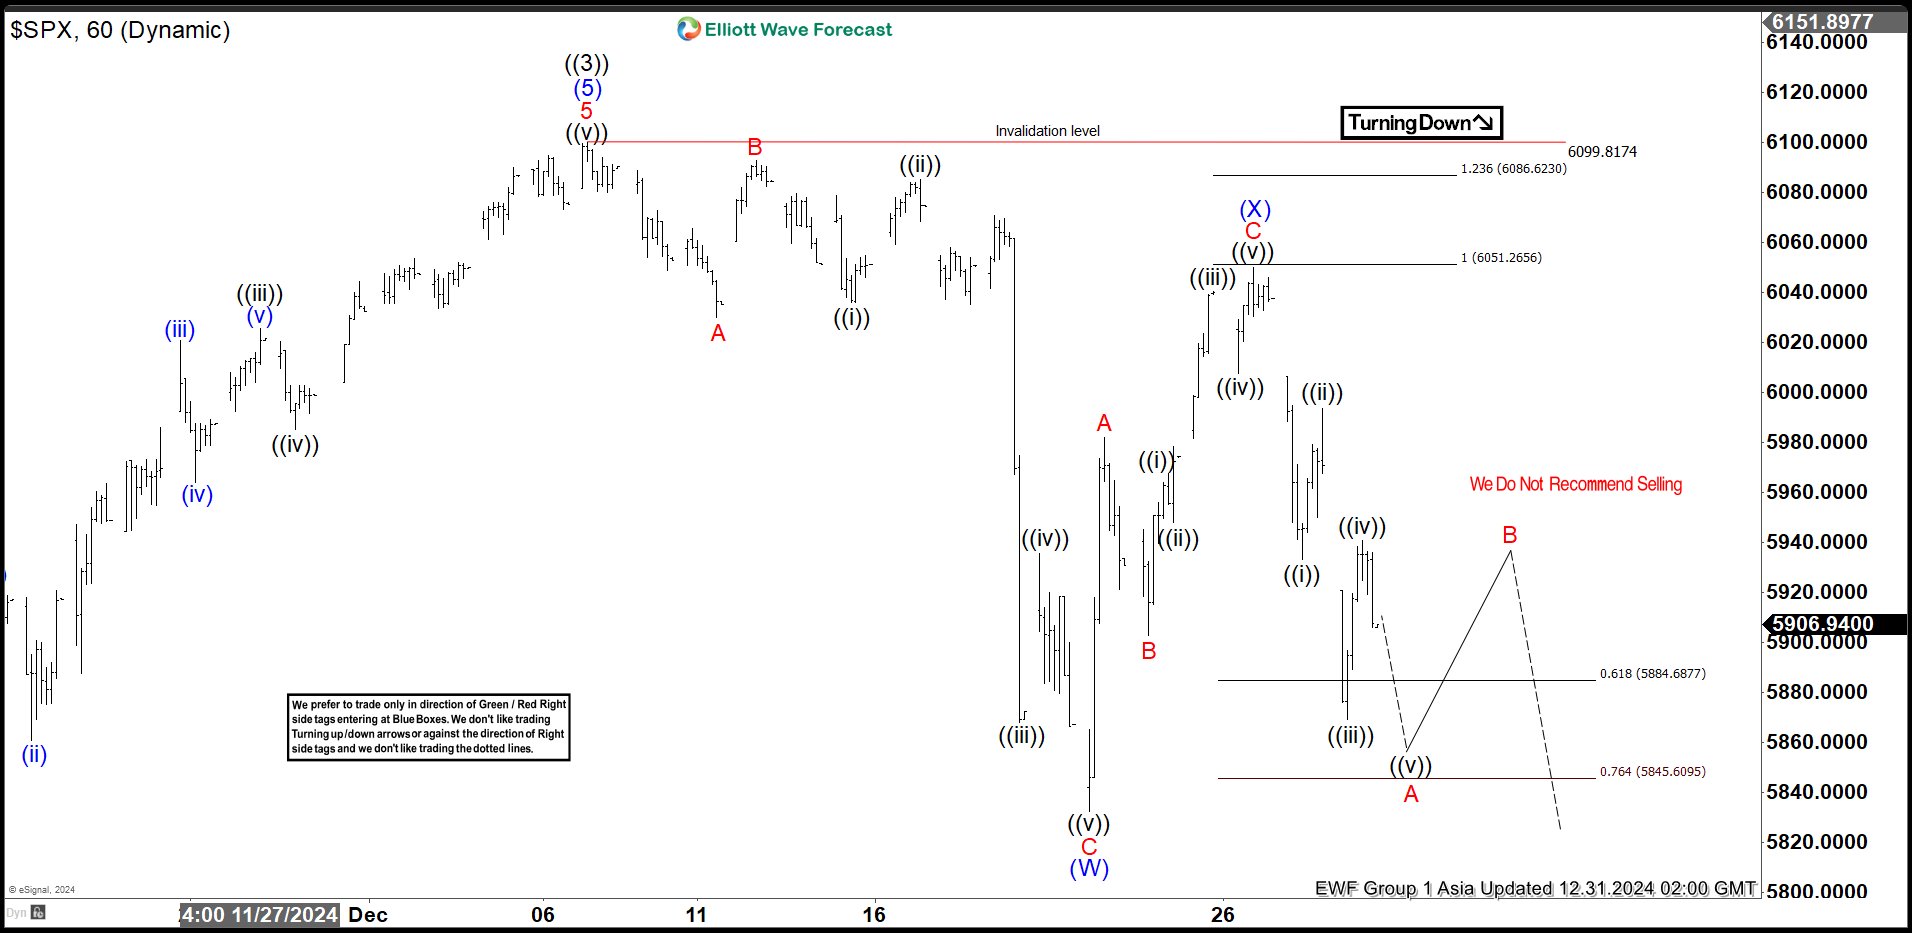
SPX H1 Update 12.31.2024
SPX has completed the proposed leg up, forming a 3-wave recovery at the 6051 high. We consider the (X) recovery complete at that level. As long as the price remains below this high, we expect further weakness in the (Y) leg. A break of the (W) blue low at 5831.6 is needed to confirm the proposed scenario. We do not recommend selling against the main bullish trend and will view the (Y) leg as a new buying opportunity if the next extreme zone is reached.
You can find detailed information on this trading setup in the membership area and in the Live Trading Room
90% of traders fail because they don’t understand market patterns. Are you in the top 10%? Test yourself with this advanced Elliott Wave Test
Source: https://elliottwave-forecast.com/stock-market/spx-elliott-wave/