
Small Caps Stocks: The Upside of Downside
April 26, 2019
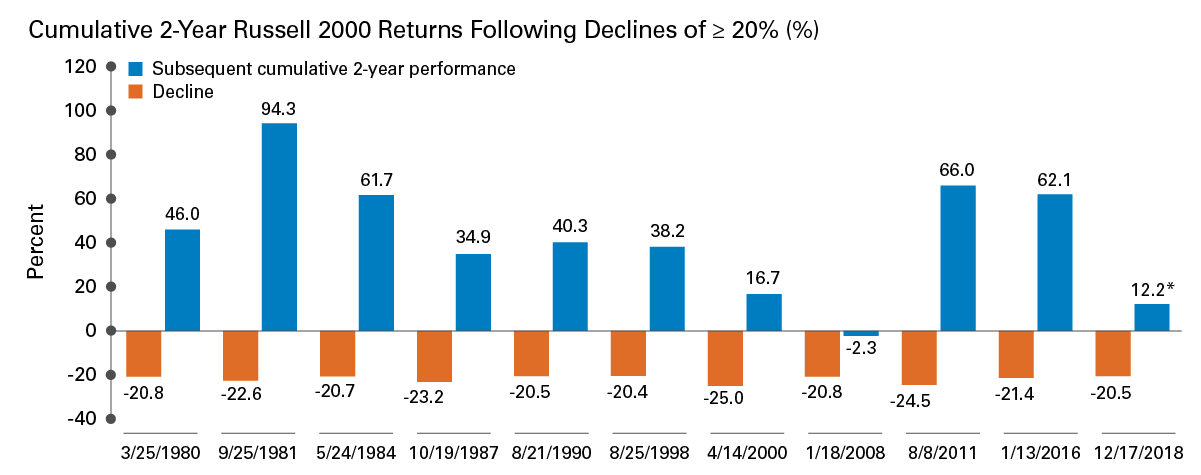
Chart courtesy of Royce & Associates. Source: Bloomberg, as of 3/31/19. Past performance is no guarantee of future results. Indexes are unmanaged, and not available for direct investment. Index returns do not include fees or sales charges. This information is provided for illustrative purposes only and does not reflect the performance of an actual investment. *As of 3/31/19.
THE CHART
The chart shows declines in the Russell 2000 Index since 1980 that have exceeded 20% and the subsequent two-year cumulative total returns that followed. The dates represent the respective first day of the 20%+ declines and subsequent performance is measured from that date.
THE BOTTOM LINE
- Small-cap stocks can certainly be volatile, but history shows that those willing to persevere through downturns have often found benefit in the rebounds.
- Consider that on eleven occasions over the past four decades, the Russell 2000 experienced drawdowns that exceeded 20%—the fourth quarter of 2018 being the most recent example (-20.5%).
- In most cases these pullbacks gave way to strong rebounds over the following two years, with the average 2-year cumulative total return at 45.8%.
- The only exception to a positive return was the two-year period following the 2008 financial crisis.
- Most recently, the rebound that began in mid-December continues, with a 12.2% gain through March 31 (as shown above)—which has extended to a 15.8% gain through April 24th.1
- Will the current rebound go higher, in line with the historical average? Only time will tell, but the more important question to explore may be which companies and sectors are in the best position to lead going forward .
More from Legg Mason Global Asset Management

The most important insight of the day
Get the Harvest Daily Digest newsletter.