ElliottWave-Forecast has built its reputation on accurate technical analysis and a winning attitude. By successfully incorporating the Elliott Wave Theory with Market Correlation, Cycles, Proprietary Pivot System, we provide precise forecasts with up-to-date analysis for 50 instruments including FX majors, Gold, Silver, Copper, Oil, Natural Gas, Soybeans, Sugar ,Corn TNX and a number of Equity Indices from around the World. Our clients also have immediate access to our proprietary Actionable Trade Setups, Market Overview, 1 Hour, 4 Hour, Daily & Weekly Wave Counts. Weekend Webinar, Live Screen Sharing Sessions, Daily Technical Videos, Elliott Wave Setup videos, Educational Resources, and 24 Hour chat room where they are provided live updates and given answers to their questions. The guidance of ElliottWave-Forecast gives subscribers the wherewithal to position themselves for proper entry and exit in the Forex marketplace. We believe our disciplined methodology is pivotal for long-term success in trading.
Silver ETF $SLV Larger Cycles and Elliott Wave
Silver ETF $SLV Larger Cycles and Elliott Wave
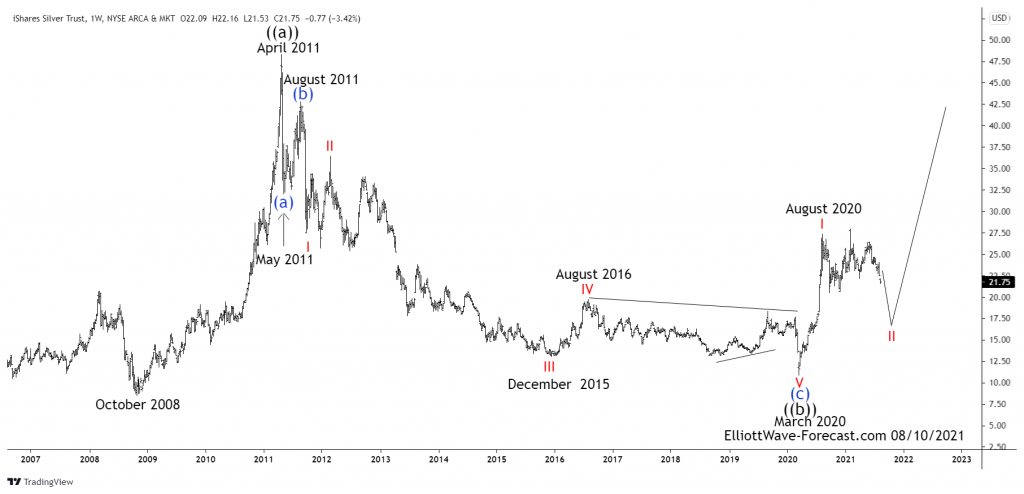
Firstly there is data back to when the ETF fund began in 2006 as seen on the weekly chart shown below. The fund made a low in 2008 at 8.45 that has not since been taken out in price. It could have been up until The point of the spike higher in July 2020. You should be able to assume from the October 2008 lows to the April 2011 highs was a larger degree impulse ending from all time Silver lows either way.
Secondly, the decline from the April 2011 highs down to the May 2011 lows was five waves. Price held below the April 2011 highs during the bounce from the May 2011 lows to the August 2011 high.
The analysis continues below the weekly chart.
Thirdly, the cycle from the August 2011 high now appears complete. The red I , II & III decline to the December 2015 lows best looks as two Elliott Wave impulses. The bounce to the August 2016 high was strong enough to suggest it had corrected the cycle from the red wave II highs in February 2012. From the August 2016 high the decline appears to be an Elliott Wave triangle structure that ended the wave “E” at the February 2020 highs. From this point in time the instrument printed a clean Elliott wave impulse lower into the March 2020 lows at 10.87.
In conclusion. Down from the April 2011 highs SLV exhibits all qualities of an Elliott Wave zig zag structure that now appears complete at this point. This is partially due to the bounce from the March 2020 lows. It was strong enough and apparently in five waves. This suggests the correction of the cycle up from the all time lows has completed. Near term while below 26.00 more weakness can be seen before a turn higher again.
Source: https://elliottwave-forecast.com/stock-market/silver-etf-slv-larger-cycles-and-elliott-wave/


