ElliottWave-Forecast has built its reputation on accurate technical analysis and a winning attitude. By successfully incorporating the Elliott Wave Theory with Market Correlation, Cycles, Proprietary Pivot System, we provide precise forecasts with up-to-date analysis for 50 instruments including FX majors, Gold, Silver, Copper, Oil, Natural Gas, Soybeans, Sugar ,Corn TNX and a number of Equity Indices from around the World. Our clients also have immediate access to our proprietary Actionable Trade Setups, Market Overview, 1 Hour, 4 Hour, Daily & Weekly Wave Counts. Weekend Webinar, Live Screen Sharing Sessions, Daily Technical Videos, Elliott Wave Setup videos, Educational Resources, and 24 Hour chat room where they are provided live updates and given answers to their questions. The guidance of ElliottWave-Forecast gives subscribers the wherewithal to position themselves for proper entry and exit in the Forex marketplace. We believe our disciplined methodology is pivotal for long-term success in trading.
S&P 500 E-Mini (ES_F) Elliott Wave: Forecasting the Rally From Equal Legs Zone
Hello traders ! In this technical article, we’re going to take a quick look at the Elliott Wave charts of the S&P 500 E-Mini (ES_F Futures) , published in the members area of the website.
As our members know, $ES_F recently pulled back and found buyers at the equal legs area. The main outlook remains bullish. Here’s our Elliott Wave Forecast and what to expect next.
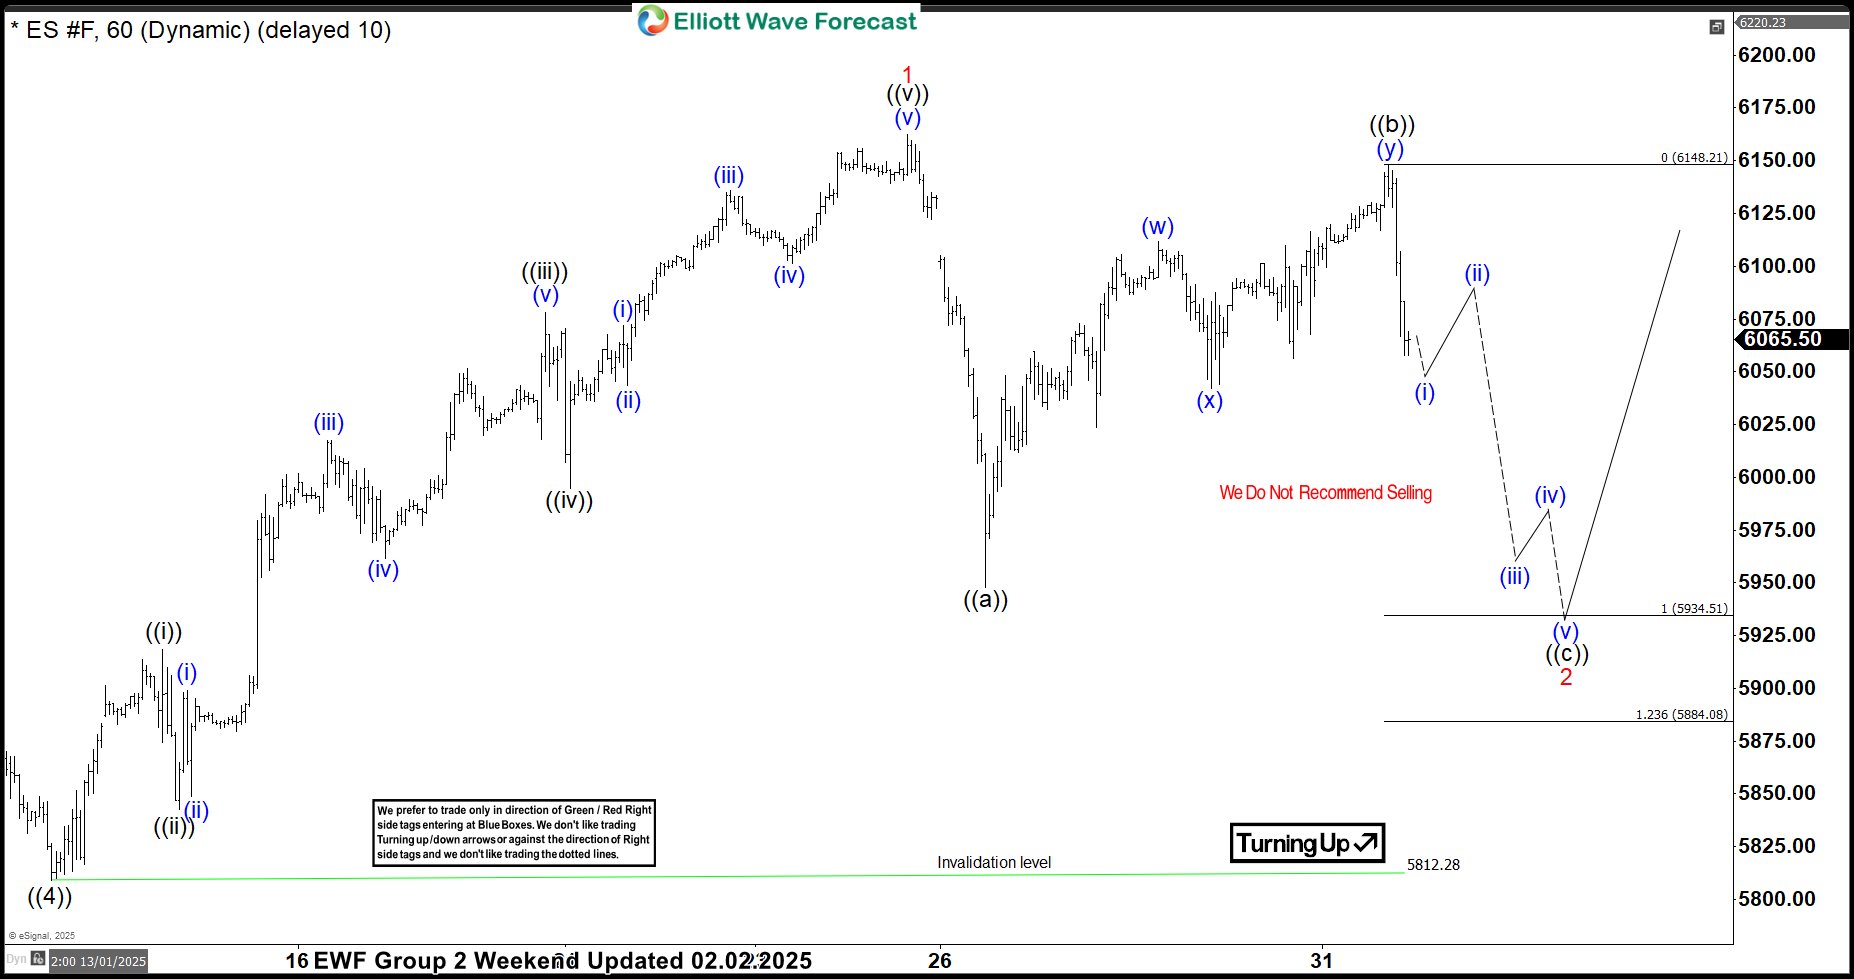
ES_F Elliott Wave 1 Hour Chart 02.02.2025
$ES_F has made a clear five-wave decline from the peak—((a)) in black—followed by a three-wave bounce in ((b)), as expected. Since the decline unfolded in 5 waves, we assume ES_F completed only the first leg of a deeper Zig Zag pattern. As long as the price remains below the 6148.21 peak, $ES_F is likely now in the final ((c)) leg of the correction. We expect the decline toward the 5935–5884 area to complete wave 2 (red) before the larger trend resumes.
90% of traders fail because they don’t understand market patterns. Are you in the top 10%? Test yourself with this advanced Elliott Wave Test
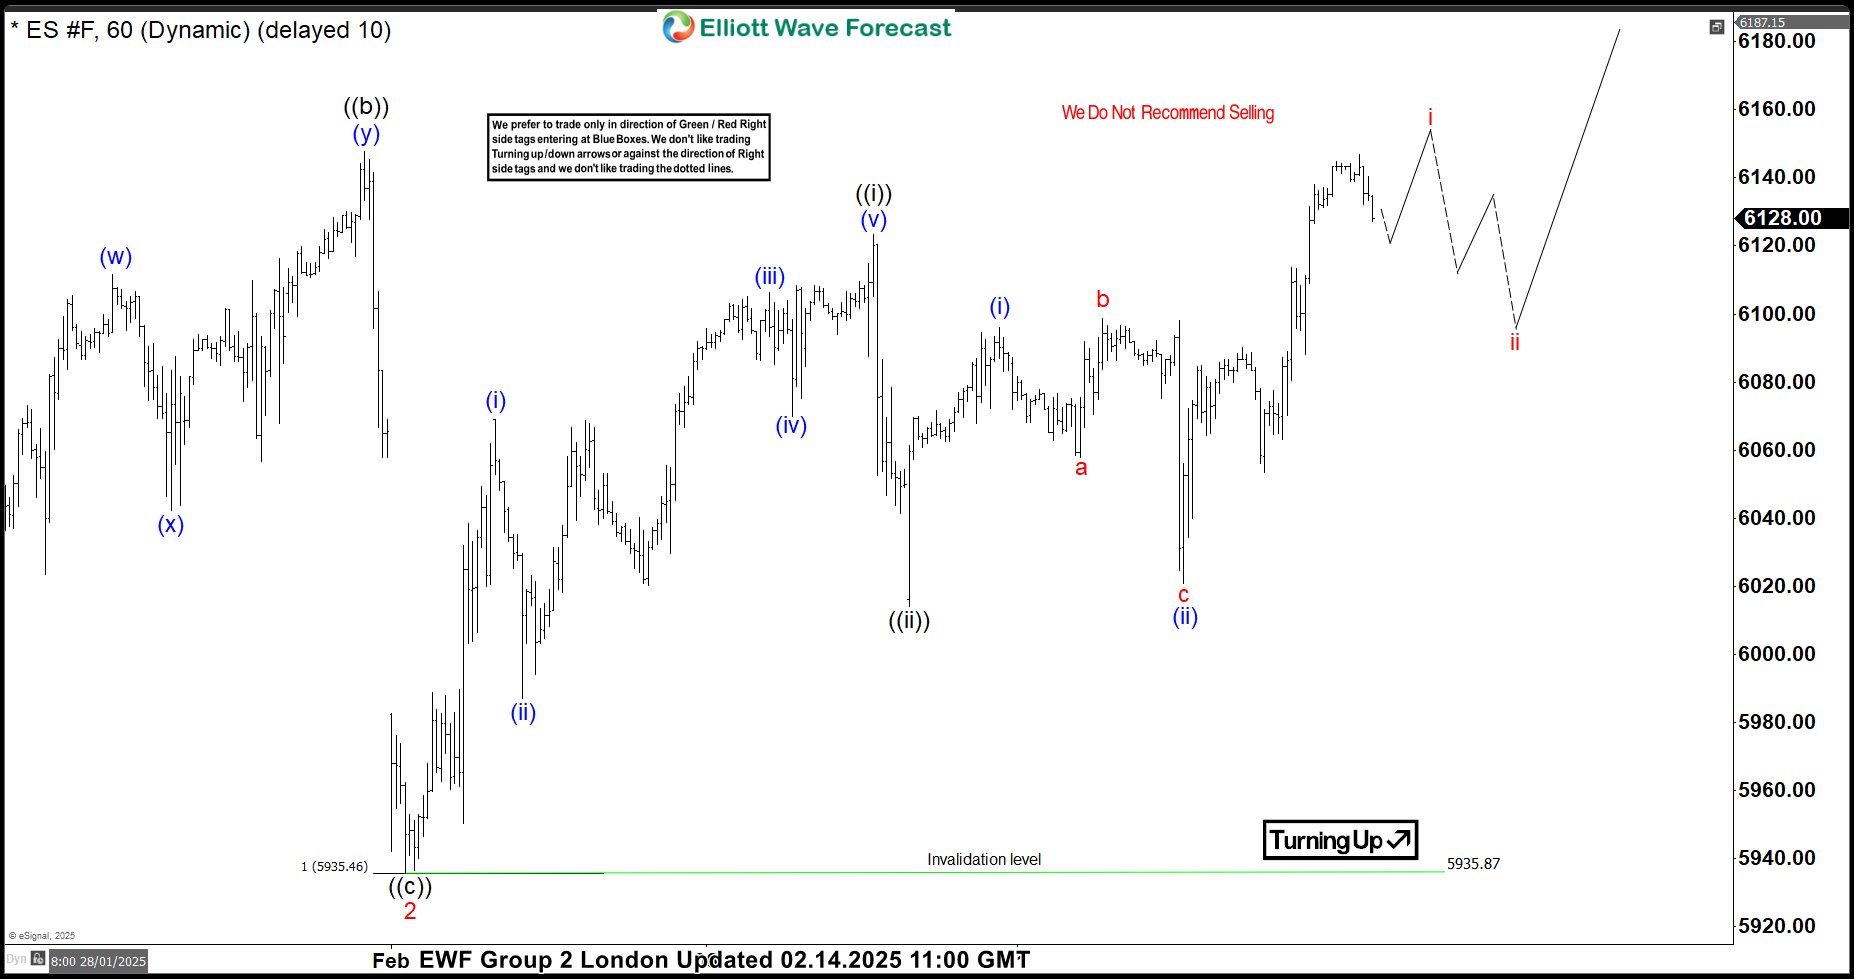
ES_F Elliott Wave 1 Hour Chart 02.14.2025
ES_F made another leg down, following a 5-wave structure toward the extreme zone. It found buyers and turned higher as expected. Now, we’d like to see a break above the January 24th peak, which will confirm further extension to the upside. The futures should ideally remain supported as long as the pivot at the 5935 low holds.
Reminder for members: Our chat rooms in the membership area are available 24 hours a day, providing expert insights on market trends and Elliott Wave analysis. Don’t hesitate to reach out with any questions about the market, Elliott Wave patterns, or technical analysis. We’re here to help.
Source: https://elliottwave-forecast.com/stock-market/sp-500-e-mini-es_f-elliott-wave-3/


