
Rising LNG Tide Changes How It’s Priced and Traded
Supply and demand growth in liquefied gas benefits some producers more than others. For investors in U.S. upstream gas producers and Gulf Coast LNG infrastructure, caveat emptor.

Markets are complex systems, and energy markets are among the most complex. Surging energy demand doesn’t necessarily trigger price spikes if growth in supply is stronger still. Yet supply reliability amid evolving contract terms can factor in at least as heavily as price, if not more so for some major consumers, creating a shifting playing field for energy companies and their investors.
Take the market for liquified natural gas (LNG). Northeast Asia is the world’s largest importer of the fuel, which is produced by chilling methane gas into a liquid form, greatly increasing its energy density and enabling cost-efficient storage and transport. Japan, Korea, Taiwan and China collectively imported 192 million metric tons (mt) of LNG in 2018, representing 62% of global demand, according to S&P Global Platts.1 Global trade in LNG rose 10% last year to 316.5 million mt, marking a fifth consecutive annual record.2
Alongside its rampant growth, the trading of LNG is changing as well, thanks largely to the impact that the U.S. shale revolution is having on global LNG supply on the one hand and China’s growing demand for it on the other, notwithstanding the fallout from the trade war between the world’s two-largest economies. That’s because, in a growing shift from past practice, LNG cargoes are becoming fungible, or interchangeable, much like crude oil, as contract supply terms shorten and restrictions on destination are increasingly lifted, though it’s not a uniform shift.
“Spot market” cargoes are increasingly common in ports long accustomed to receiving contracted deliveries. “Spot deals collected by S&P Global Platts in Northeast Asia have jumped 57% in 2019 year-on-year from January-September to 392,” the index and data provider reported.3 “This follows an 82% jump in the whole of 2018 versus 2017.” Globally, non-long-term contracts grew 19% annually in 2017 and 18% in 2018, lifting the volume of spot contracts to almost 100 million tons per annum (mtpa), or 31% of total LNG trade last year.4
Rising Liquefaction, Regasification and FSRUs Open New Markets
LNG started out as a regionally contracted commodity in Europe and the Pacific Basin. But it was largely driven by Japan, which remains the world’s largest LNG importer, though it’s expected to be overtaken by China in a few years. Japanese utilities traditionally contracted LNG shipments at fixed prices based on a discount to a weighted price average of the “Japan Crude Cocktail,” which comprises a wide variety of imported crude oil grades. Those LNG suppliers needed long-term contracts and financing arrangements from committed buyers to build out the export infrastructure and guarantee future income streams to cover the associated debt servicing amid fluctuating oil and gas prices.
With the U.S. having surpassed Saudi Arabia last year and Russia in 2011 as the world’s largest producer of oil and natural gas, respectively, it didn’t take long before gas prices started falling, and not just in the U.S. Alongside the deep slide in crude prices starting in mid-2014, Australia was ramping its natural gas production and liquefaction capacity, joining Qatar and Malaysia as the world’s top LNG exporters. Now it’s the U.S. and Russia that are fueling a glut in global gas supplies by developing their gas resources, pipeline and LNG production infrastructure, creating an overhang on prices running from Northeast Asia to Europe.
Gas Flows to U.S. LNG Terminals
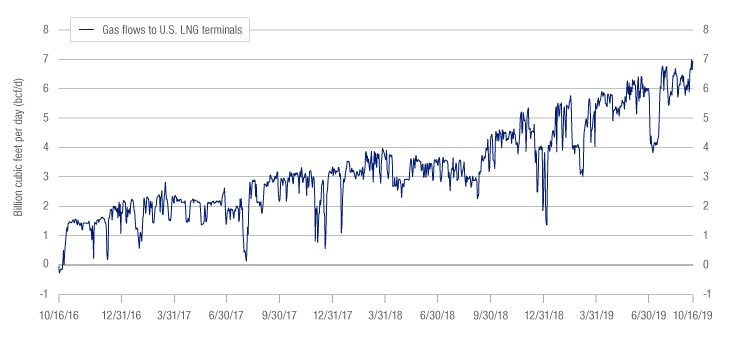
Source: Bloomberg, bcf/d (billion cubic feet/day)
“Natural gas delivered by pipelines to Mexico and to U.S. LNG export facilities reached 10.9 billion cubic feet per day (bcf/d) in July and averaged 10 bcf/d in the first seven months of this year, 30% more than in the same period of 2018,” the U.S. Energy Information Administration (EIA) reports. The U.S. overtook Malaysia as the world’s third-largest LNG exporter earlier this year, averaging 4.2 bcf/d from January through May. As more gas pipeline infrastructure comes on line, record gas flows are hitting U.S. LNG terminals, which in October received 7.15 bcf/d, up from next to nothing in 2016, when re-tooled facilities originally designed to receive and re-gasify LNG began to export it.
Gas Prices: What Goes Down Must Not Necessarily Come Up
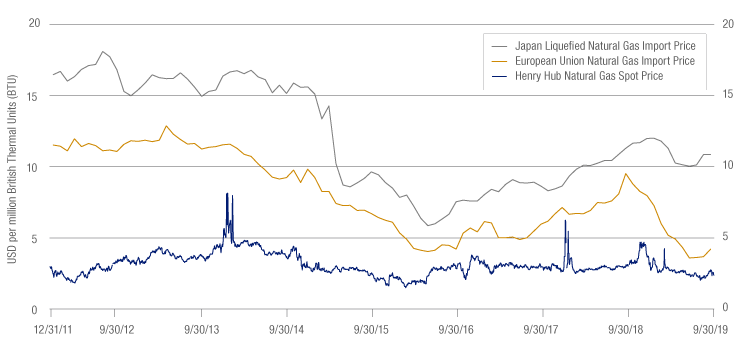
Source: YCharts; Japan’s gas import price based on LNG import price
Russia’s gas output growth has been slower in recent years, but its ramp is taking off. The Yamal Peninsula is on track to join two other key gas production areas in the country that over the medium term should catapult potential yearly production about 50% higher to roughly 1 trillion cubic meters, up from 669 bcm at the end of 2018.5 Some of that increase will represent more exports via pipeline, such as the 38 bcm/y Power of Siberia pipeline to China that’s expected to come online by end-2019. But the expected increase in Russia’s liquefaction infrastructure also stands out: new-build additions to liquefaction capacity are slated to total nearly 19 mtpa to 2023, nearly doubling the current 21.8 mtpa, according to International Gas Union (IGU) and analytics company Global Data.
By February 2019, global liquefaction capacity rose 7% on an annual basis to 393 mtpa. Nearly 52 mtpa in new capacity is slated to come on line this year, while proposed, or pre-FID (final investment decision) capacity, amounts to 842.5 mtpa by 2025, according to IHS Markit data cited by the IGU, with the U.S., Russia and Canada leading the expected expansion. Meanwhile, global nominal regasification capacity reached 824 mtpa in February, including 80.1 mtpa of floating, storage and regasification units (FSRU), which can provide real flexibility to energy importers developing onshore regasification terminals.
“Increasingly flexible supply has supported LNG trade growth, and FSRUs have played a larger role in allowing new markets to access LNG supply at a faster rate,” the IGU notes. “LNG trade growth has also benefited from previous periods of lower global LNG prices, driving demand in markets such as India, as well as measures for reduction in air pollution as observed in China. A large portion of the next group of LNG importers…are from emerging, higher credit risk regions. However, new markets continue to join the ranks of LNG importers even in established importing regions like Europe.”
The Rise of Regional Hubs
Because natural gas supplies are rising, prices are falling, spurring demand. And because it burns far more cleanly than other hydrocarbon-based fuels such as coal or oil-derived diesel and gasoline, China, India, other emerging markets as well as Europe are importing more of it, expanding regasification capacity and increasingly changing the terms by which much LNG is purchased.
In North America prices are effectively established at liquid trading hubs, the most influential being Henry Hub in the U.S. Gulf Coast. While wholesale gas in Europe is still mostly traded on a long-term contract basis with much pricing oil linked, gas hub pricing is rising rapidly. The driver? “The delivered costs of U.S. LNG provide an increasingly important reference point for global markets, given the flexibility of its destination-free supply as well as the liquidity and pricing transparency of the U.S. market,” IGU points out.
Thanks to the gusher of U.S. gas, Henry Hub trades at a discount to other major gas benchmarks in Europe and Asia, spurring more and more buyers globally to ink offtake agreements linked to Henry Hub. But European hub prices are also low, given the region’s ample storage capacity. “This capacity is nearly full; as of Sept. 21, European storage stood at 97.5 billion cubic meters, up 22% year over year,” said Thornburg Portfolio Manager Matt Burdett. “Stock levels were 20.1 bcm higher than the five-year average. If there is another warm winter, we could see even lower gas prices.”
For several years now, a rising number of European gas contracts have been “signed or renegotiated to include hub gas price indexation [particularly in Northwest Europe], dropping the historically dominant links to crude and fuel oil,” the IGU notes. Meanwhile, market worries have grown that Northeast Asian LNG buyers might pressure suppliers to revise contract terms as well. But Burdett, who recently returned from an LNG research trip to Beijing, Tokyo and Singapore, reports that pending contract renegotiations “are not likely to be as game-changing as some have feared.”
Navigating Gas Market Demand and Supply Flows
“Though the contracts are not likely to be on better terms, i.e., higher prices for producers, only small changes are likely because buyers simply do not want to take too much spot market risk,” he points out. Northeast Asian buyers may be willing to allocate 10% to 20% or so of their LNG portfolio exposures to spot purchases, though only when security of supply is very clear. “Spot pricing volatility is a constraint when their goal is to match customer demand and pricing structures,” Burdett explains. “Supply security is more important than trying to squeeze suppliers.”
That’s good news for select integrated energy companies known as supermajors. Macquarie Research reports nearly 40 mtpa of estimated LNG volumes in Japan, Korea and China may be up for contract pricing reviews this year and next. Yet the supermajors are also well positioned to take advantage of destination-free, spot deliveries, Burdett points out, thanks to their global production, processing, storage and trading capabilities. “They have more freedom to buy and sell at different sources.”
And unlike straight U.S. oil and natural gas exploration and production companies, which are more subject to the vagaries of energy prices and investor sentiment, diversified supermajors have greater ability to navigate the complex ebbs and flows in supply and demand in both upstream and downstream oil and gas markets.
For example, at 9% or so in 2020, China’s forecast gas demand growth is strong. But that’s half its estimated demand growth this year. “Demand in China is being crimped by the trade war,” Burdett points out. “Local governments won’t necessarily use higher-cost gas to replace coal-fired industrial boilers, which is the biggest source of demand in the country.” At the local level, economic growth often matters more than Beijing’s push for a cleaner environment, he adds.
Yet as rising gas supply drives prices lower and security of supply increases, China’s coal-to-gas switching could accelerate, particularly if the trade conflict abates and China’s overall economic growth stabilizes as a result. “China could provide material gas demand growth for years to come,” Burdett says. “But not necessarily for U.S. shale gas producers and LNG export terminals, whose natural geographic market is a well-supplied Europe when factoring in liquefaction and shipping costs. For Chinese buyers, the trade war has also left a lasting memory and will influence where they choose to source their long-term gas.”
1. S&P Global Platts, JKTC: The World’s LNG Spot Trading Hub, Oct. 15, 2019.
2. International Gas Union (IGU), 2019 World LNG Report.
3. S&P Global Platts, ibid.
4. IGU, ibid.
5. BP, Bloomberg.
Originally published: Rising LNG Tide Changes How It’s Priced and Traded
Important Information
Before investing, carefully consider the Fund’s investment goals, risks, charges, and expenses. For a prospectus or summary prospectus containing this and other information, contact your financial advisor or visit thornburg.com . Read them carefully before investing.
SHOW LESS
The performance data quoted represents past performance; it does not guarantee future results.
The views expressed are subject to change and do not necessarily reflect the views of Thornburg Investment Management, Inc. This information should not be relied upon as a recommendation or investment advice and is not intended to predict the performance of any investment or market.
Investments carry risks, including possible loss of principal.
International investing involves special risks including currency fluctuations, illiquidity, volatility, and political and economic risks. These risks may be heightened in emerging markets.
Please see our glossary for a definition of terms.
Thornburg mutual funds are distributed by Thornburg Securities Corporation.
Thornburg Investment Management, Inc. mutual funds are sold through investment professionals including investment advisors, brokerage firms, bank trust departments, trust companies and certain other financial intermediaries. Thornburg Securities Corporation (TSC) does not act as broker of record for investors.
Any securities, sectors, or countries mentioned are for illustration purposes only. Holdings are subject to change. Under no circumstances does the information contained within represent a recommendation to buy or sell any security.
To learn more, please visit www.thornburg.com
The views expressed by the portfolio managers reflect their professional opinions and are subject to change. Under no circumstances does the information contained within represent a recommendation to buy or sell any security. Investments carry risks, including possible loss of principal. Investments carry risks, including possible loss of principal. Portfolios investing in bonds have the same interest rate, inflation, and credit risks that are associated with the underlying bonds. The value of bonds will fluctuate relative to changes in interest rates, decreasing when interest rates rise. Unlike bonds, bond funds have ongoing fees and expenses. Investments in the Funds are not FDIC insured, nor are they bank deposits or guaranteed by a bank or any other entity. Please see our glossary for a definition of terms: http://www.thornburg.com/legal/glossary.aspx Thornburg mutual funds are distributed by Thornburg Securities Corporation. Thornburg Investment Management, Inc. mutual funds are sold through investment professionals including investment advisors, brokerage firms, bank trust departments, trust companies and certain other financial intermediaries. Thornburg Securities Corporation (TSC) does not act as broker of record for investors.
Before investing, carefully consider the Fund’s investment goals, risks, charges, and expenses. For a prospectus or summary prospectus containing this and other information, contact your financial advisor or visit our literature center. Read them carefully before investing: https://www.thornburg.com/forms-literature/product-literature/mutual-funds/index.aspx
