Q1 2020 Ag Update

Q1 2020 Ag Update
Options Update – Seasonality
Options have several clear seasonal patterns which could potentially be used by traders and hedgers in making strategy decisions.
Skew
Call premiums usually trade at a premium to puts but more so in the Northern Hemisphere Summer months.
- Corn has the largest range in skew throughout the calendar year from 2% up to 7.5%
- Call skew peaks in June for Corn and Soybeans
- Chicago Wheat skew does not exhibit the same seasonality of Corn and Soybeans
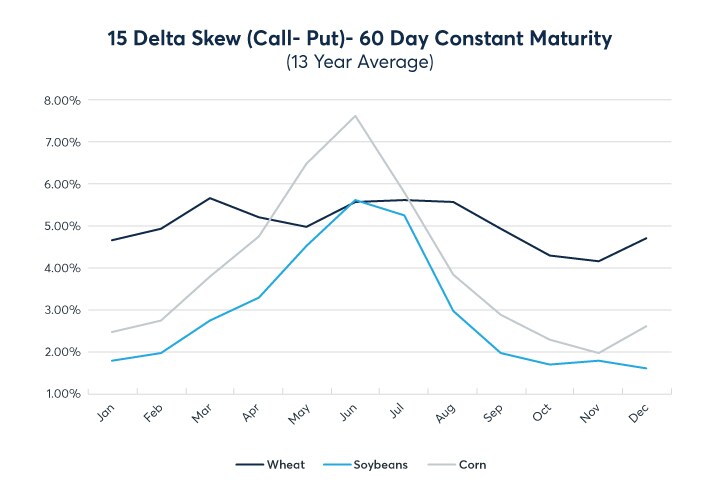
QuikStrike data powered by QuikVol
Volatility
Implied Volatility is driven in large part by seasonal production risks.
- Corn has shown the widest range in implied volatility throughout the calendar year, the lowest point occurring in February and November
- Implied volatility historically peaks in June for Corn, Soybeans and Chicago Wheat
- On average Chicago Wheat shows the lowest 60 day implied vol in November
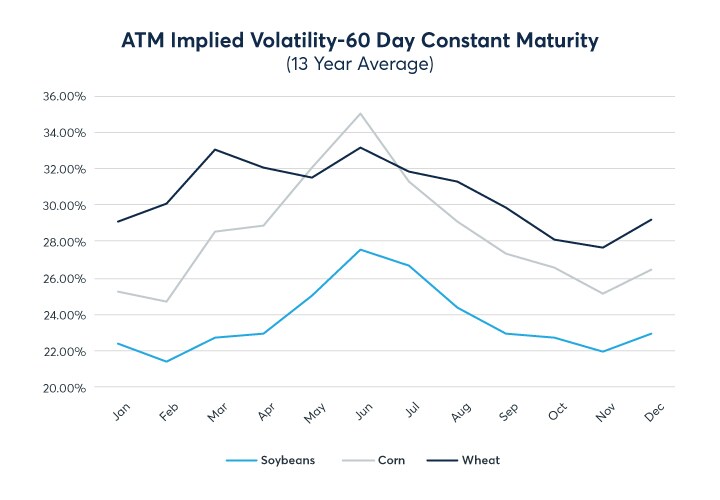
QuikStrike data powered by QuikVol
Pricing, Volatility & Strategy Tools
CME has a suite of free QuikStrike tools to calculate fair values prices and Greeks on CME Group Options, chart volatility and correlations and test strategies in simulated markets
Explore Options Strategy Tools
Fertilizer
CME first listed cleared fertilizer swaps in 2011 for Urea, UAN, and DAP, however, not all customers could access the cleared swaps. In June 2019, fertilizer futures were listed side by side with swaps to improve market access.
Key Features
- Financially settled against leading fertilizer price reporting agencies Profercy and ICIS
- 100-ton contracts
- Include: Urea US Gulf, Urea Egypt, UAN NOLA, DAP NOLA, Urea Brazil, and MAP Brazil
- Low minimum block threshold of 2 contracts and a number of block brokers to facilitate trade.

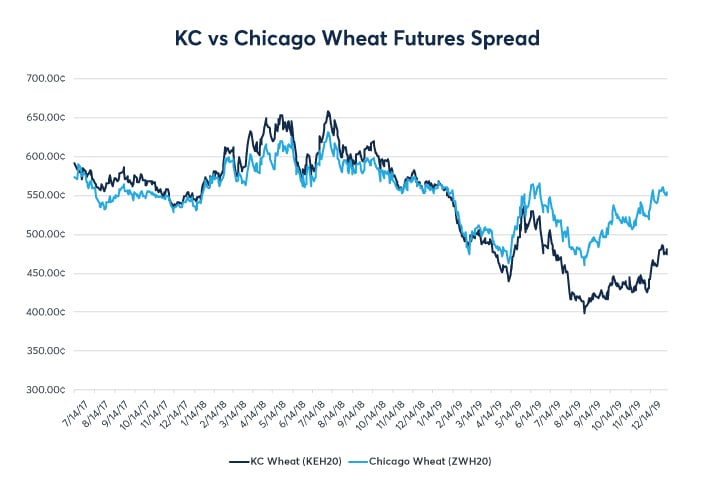
Whitepaper: KC vs. Chicago Wheat Spread: A Tale of Two Markets
Starting in 2019 and going into 2020, The Kansas City Wheat futures (KE) contract has traded at an unusual discount relative to Chicago Wheat futures (ZW). With the Mar 2020 KE contract trading at a 75 cent per bushel discount and the Dec 2020 KE contract trading at a 65 cent per bushel discount, the market’s current expectations imply continued tightness in the Chicago Wheat market compared to KC throughout 2020.
Find it here: KC vs. Chicago Wheat Spread: A Tale of Two Markets
Analysis of USDA data February 2000 through April 2019.
RSS Import: Original Source