Portfolio Correlation Analysis. Correlation Matrix, HCA, and PCA.
The correlation coefficient between securities has a value that falls between -1 and 1 and it measures how securities move in relation to one another. When building a Stock/ETF portfolio one can have very correlated securities, a mix, and very un-correlated securities depending on the strategy.
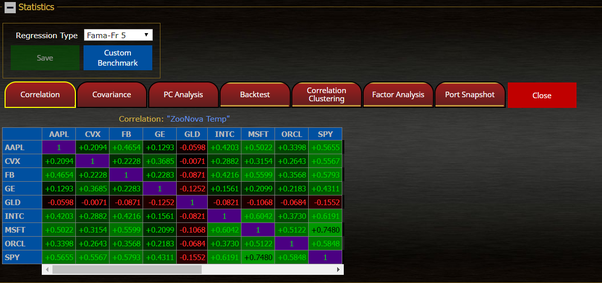
Here is first a screen image from Zoonova.com that shows a correlation matrix calculated from an underlying portfolio.
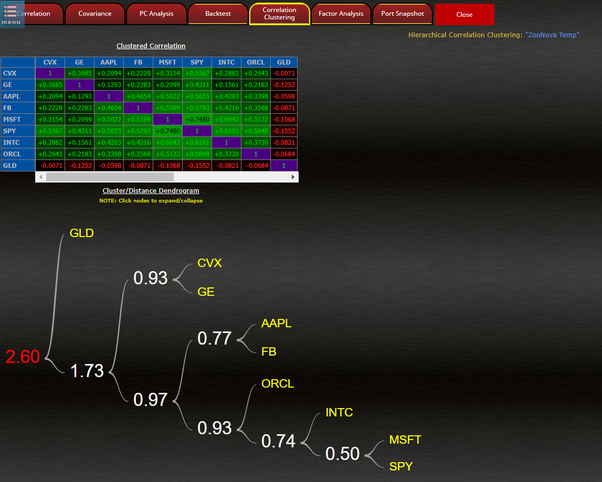
Now here is another view of the correlation matrix after calculating Hierarchical Correlation Clustering
Hierarchical Clustering (a.k.a. "hierarchical cluster analysis" or HCA) is a method of cluster analysis which seeks to build a hierarchy of clusters. ZooNova.com uses an agglomerative technique (Ward Variance Minimization algorithm) where each observation starts in its own cluster, and pairs of clusters are merged as one moves up the hierarchy – and where each pair of clusters is merged based on the optimal value of the error sum of squares. The dendrogram (tree diagram) and heat-mapped grid illustrate this resulting hierarchy.
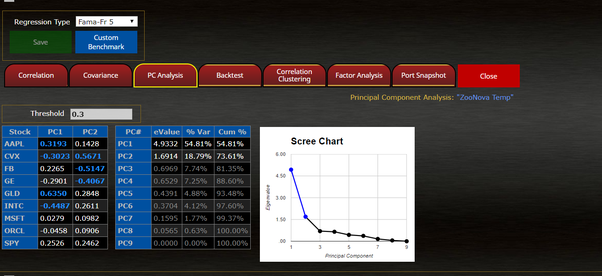
Now we can take the correlation matrix and calculate PC Analysis
Principal component analysis is a statistical technique used to analyze the interrelationships between a large number of variables and to explain them in terms of a smaller set of variables (i.e., "principal components"). Using the correlation matrix for the stock watch portfolio, eigenvalues and eigenvectors are calculated – which imply corresponding principal components. The output is as follows:
Principal component coefficients (Reduced Model)
Principal component coefficients displays eigenvectors for the principal components ( NOTE: components with an eigenvalue of less than 1 are omitted, i.e., "Reduced"). Values with a high correlation (relative to the user-defined threshold) between the principal components and the (standardized) original variables are highlighted.
Total Variance Explained
The number of components matches the number of unique stocks in a stock portfolio. Because PCA uses the correlation matrix, the variables are standardized: Values along the correlation diagonal are equal to 1, and the total variance is equal to the number of unique stocks. The columns are:
eValue
This column displays the eigenvalue (variance) of each principal components. Beginning with a variance of 1, each successive component accounts for a decreasing amount of the total variance.
% Var
This column displays the percent of variance for each principal component.
Cum %
This column displays the cumulative percentage of variance for each principal component.
Scree Plot
The Scree Plot displays the eigenvalue for each principal component (by number). Latter components cause the line to become almost flat showing that their contribution is increasingly negligible.
Correlation analysis is very important in building a Portfolio so it is important to understand these analytics.
Cheers.
