ElliottWave-Forecast has built its reputation on accurate technical analysis and a winning attitude. By successfully incorporating the Elliott Wave Theory with Market Correlation, Cycles, Proprietary Pivot System, we provide precise forecasts with up-to-date analysis for 50 instruments including FX majors, Gold, Silver, Copper, Oil, Natural Gas, Soybeans, Sugar ,Corn TNX and a number of Equity Indices from around the World. Our clients also have immediate access to our proprietary Actionable Trade Setups, Market Overview, 1 Hour, 4 Hour, Daily & Weekly Wave Counts. Weekend Webinar, Live Screen Sharing Sessions, Daily Technical Videos, Elliott Wave Setup videos, Educational Resources, and 24 Hour chat room where they are provided live updates and given answers to their questions. The guidance of ElliottWave-Forecast gives subscribers the wherewithal to position themselves for proper entry and exit in the Forex marketplace. We believe our disciplined methodology is pivotal for long-term success in trading.
Pan American Silver (PAAS): Pullback Nearing End, Upside Potential Ahead
Pan American Silver Corp. (PAAS) is a mining company based in Vancouver, Canada, focused on silver, gold, zinc, lead, and copper. Founded in 1979, it handles exploration, development, extraction, processing, and refining. The company operates in Canada, Mexico, Peru, Bolivia, Argentina, Chile, and Brazil. Below we will take a look at the Elliott Wave technical outlook.
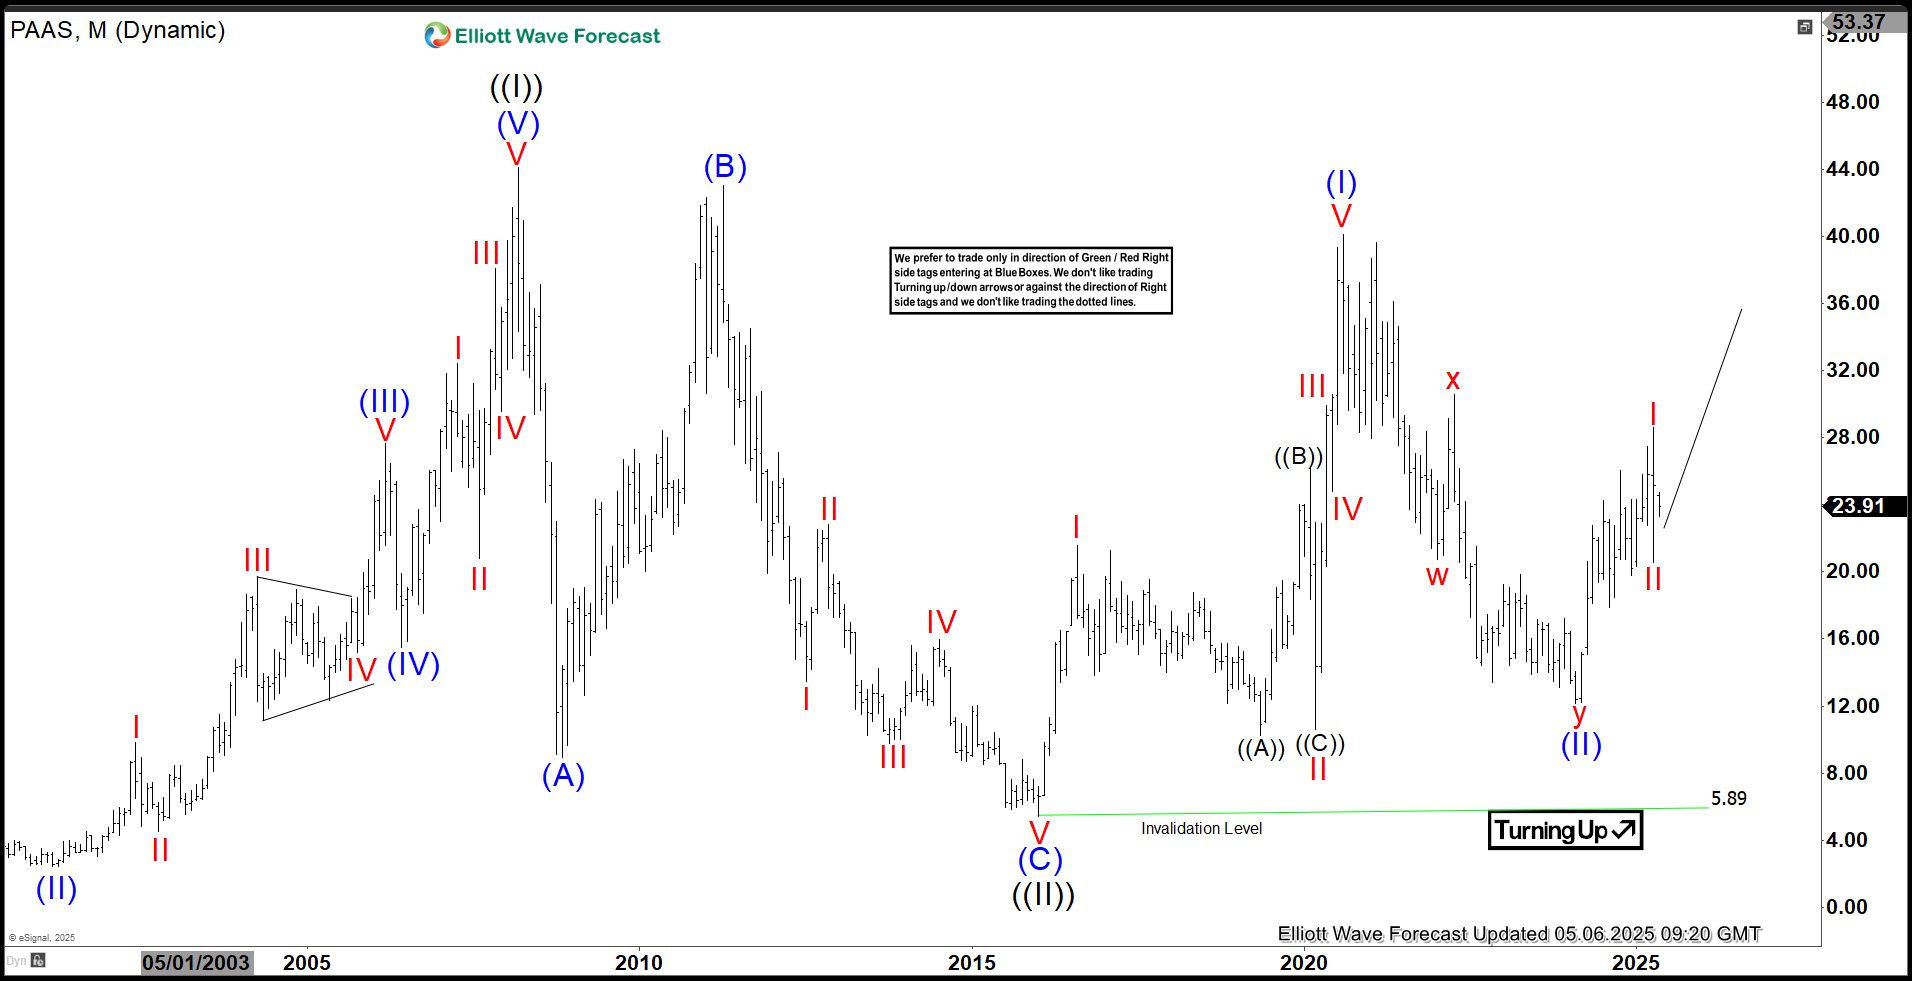
PAAS Monthly Elliott Wave Chart
The monthly Elliott Wave chart for Pan American Silver (PAAS) indicates that the wave ((II)) pullback concluded at $5.89 in January 2016. Since then, the stock has begun advancing in wave ((III)). From the wave ((II)) low, wave (I) peaked at $40.11, followed by a wave (II) pullback that bottomed at $12.16. The stock has now resumed its upward trend in wave (III). Within this wave, wave I reached $28.60, with a subsequent wave II pullback ending at $20.55. As long as the $5.89 low holds, the stock is expected to continue rising.
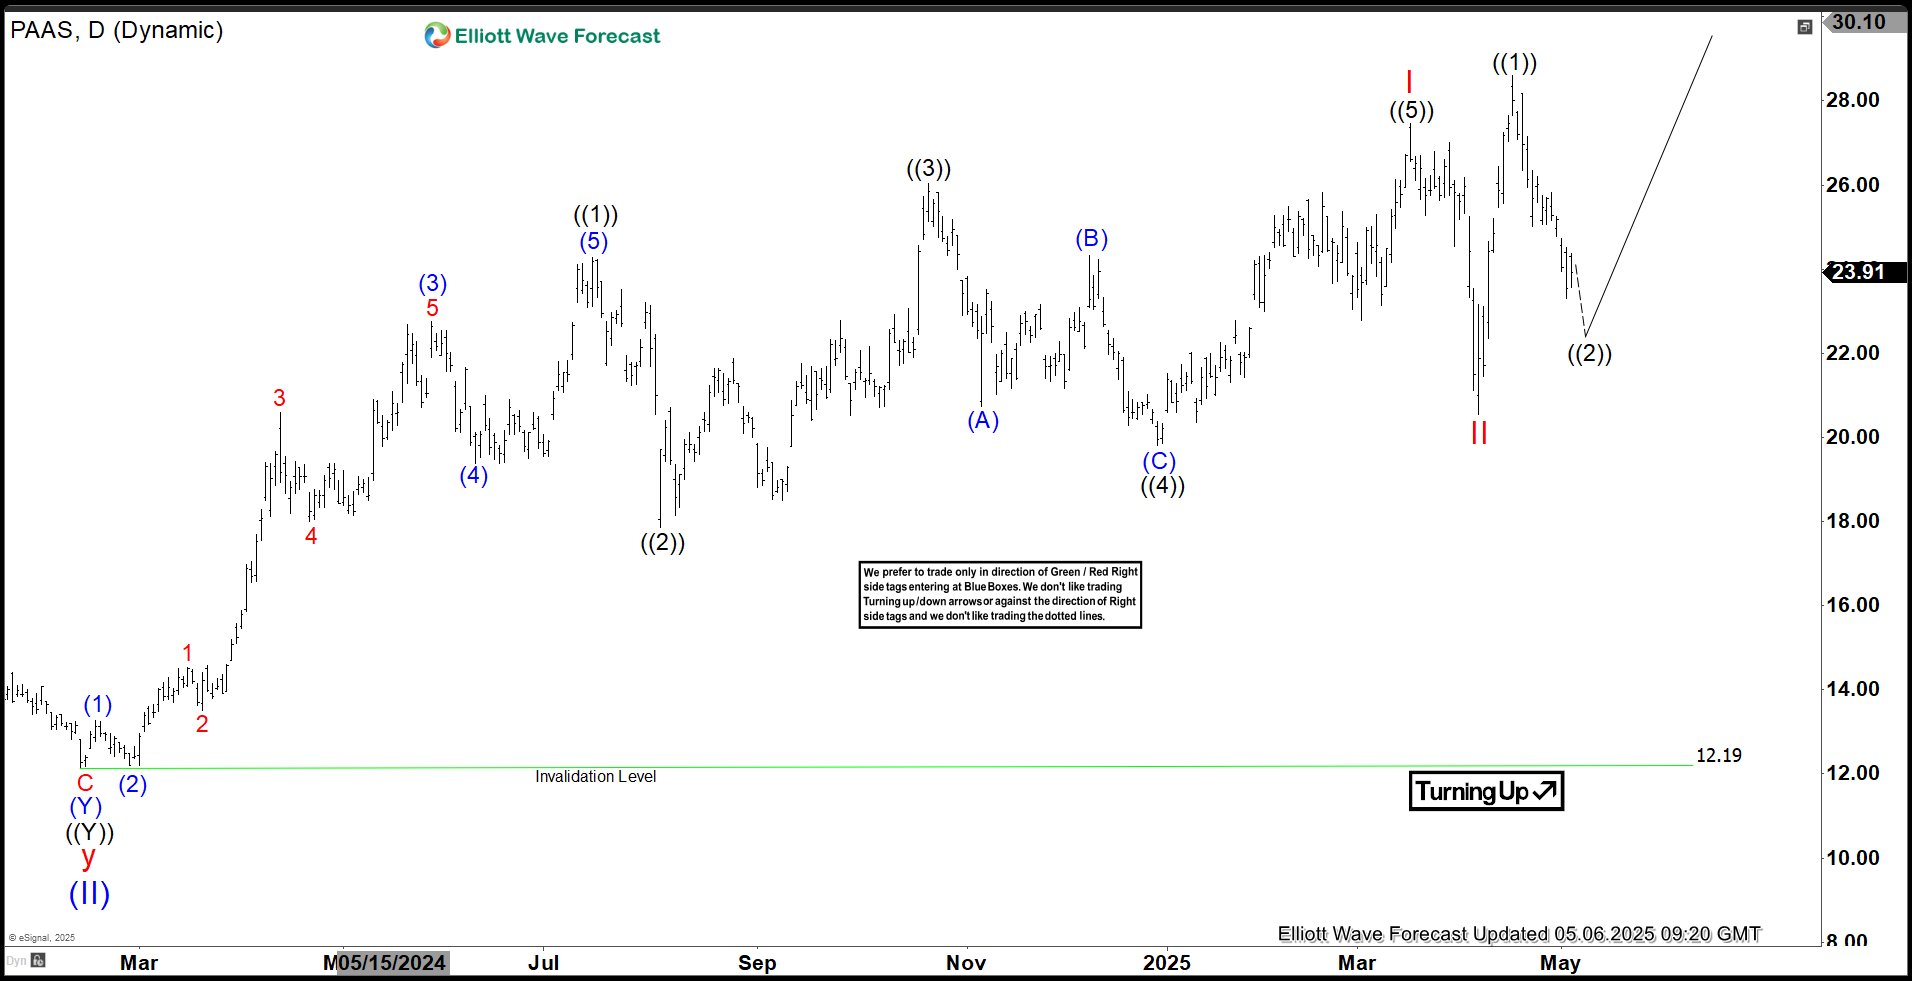
PAAS Daily Elliott Wave Chart
The daily Elliott Wave chart for Pan American Silver (PAAS) indicates that the wave (II) pullback concluded at $12.19. From this low, the stock began an upward move in wave I, structured as a diagonal pattern. Within wave I, wave ((1)) peaked at $24.27, followed by a wave ((2)) pullback to $17.86. The stock then climbed in wave ((3)) to $26.05, with a wave ((4)) dip ending at $19.80. The final wave ((5)) completed wave I at $27.47. A subsequent wave II pullback ended at $20.55. As long as the $12.19 low remains intact, the stock is expected to continue rising.
Source: https://elliottwave-forecast.com/stock-market/pan-american-silver-paas-pullback-nearing-end-upside-potential-ahead/


