Palantir (PLTR) Surges Ahead: A New Impulse Cycle Begins After April Correction
Palantir Technologies (PLTR) thrives as demand for data analytics grows. Its stock surged over 140% after Trump's election, reflecting investor confidence. The company holds a $309 billion market cap and $5.43 billion in cash reserves, ensuring financial stability. Moreover, partnerships with Bain & Company and Divergent Technologies strengthen its market influence. Although analysts warn of volatility, Palantir’s shareholder returns exceed 1000% over three years. Additionally, AI advancements enhance its competitive edge. While its stock trades above estimated fair value, continued expansion supports future growth. Consequently, Palantir remains a dominant force in the industry, prepared to capitalize on emerging opportunities.
PLTR Daily Chart Update: February 20, 2025

Last February, Elliott wave analysis suggested that PLTR would suffer a sharp drop in its share price. As expected, it lost over 20% in two days. We finished wave (III) at 125.41 but could not reach 127. The correction stopped at the 23.6% retracement of wave (III), indicating wave (IV) might have ended. If so, price action should have turned bullish towards 132.61 - 144.04 zone to complete wave I of (V). Otherwise, it could have dropped to 80.00 before rising again.
PLTR Daily Chart Analysis: June 02, 2025
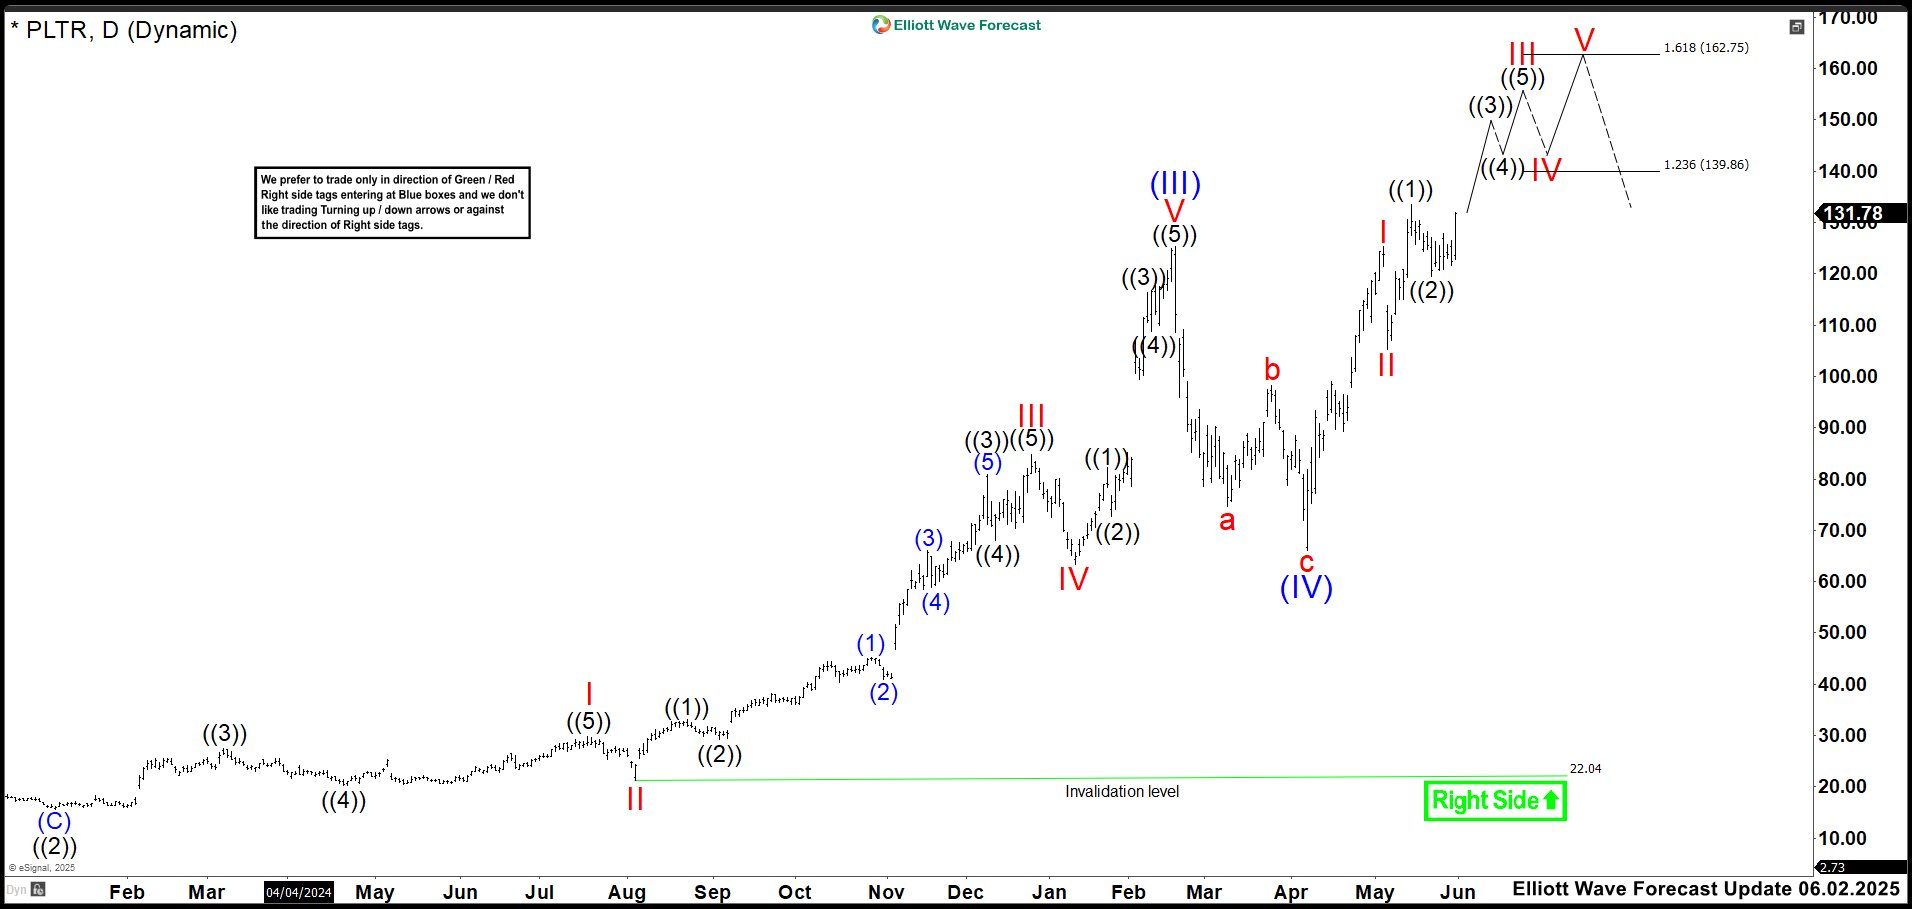
Palantir's stock not only plunged to 80.00 but also corrected in three waves, reaching 66.12 low in April. It fell to the 50% Fibonacci retracement of wave (III) retesting last wave IV prices. From there, the rally continued and broke above wave (III), confirming that wave (IV) had ended. Currently, Elliott wave analysis shows an impulse forming, possibly wave (V). Wave I of (V) peaked at 125.26, while wave II bottomed at 105.32. The price should keep rising to shape the impulse fractal. It is now in wave ((3)) of III. More bullish movement is expected toward 139.86 - 162.75 area, where the impulse may end. If no downward reaction occurs, wave III could extend further.
Palantir’s momentum signals a strong bullish cycle ahead, positioning the stock for further gains in the evolving market landscape. Therefore, the best strategy for now is buying dips. Trade Smart!
Source: https://elliottwave-forecast.com/stock-market/palantir-pltr-surges-impulse-cycle/
