Is DFS (Discover Financial) Ready For Next Move Higher?
Discover Financial Services (DFS) provides digital banking products & services, & payment services in United States. It operates through two segments – Digital banking & Payment services. It is based in Riverwoods, Illinois, comes under Financial services sector & trades as “DFS” ticker at NYSE.
DFS favors upside in wave (III), while dips remain above $79.04 low & confirms when break above $135.69 high of (I). Short term, it favors upside in (5) to complete the impulse sequence to be ((1)) of I.
DFS - Elliott Wave Latest Weekly View:
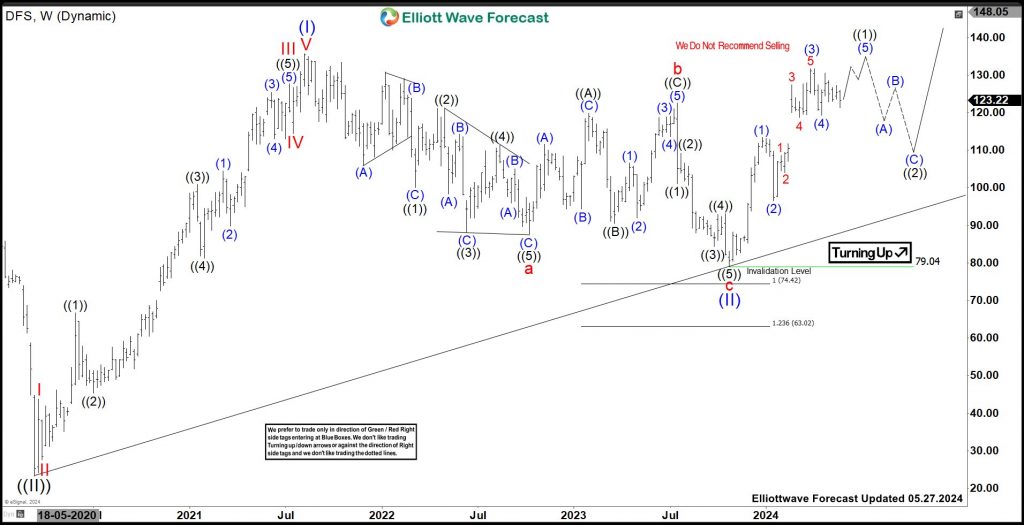
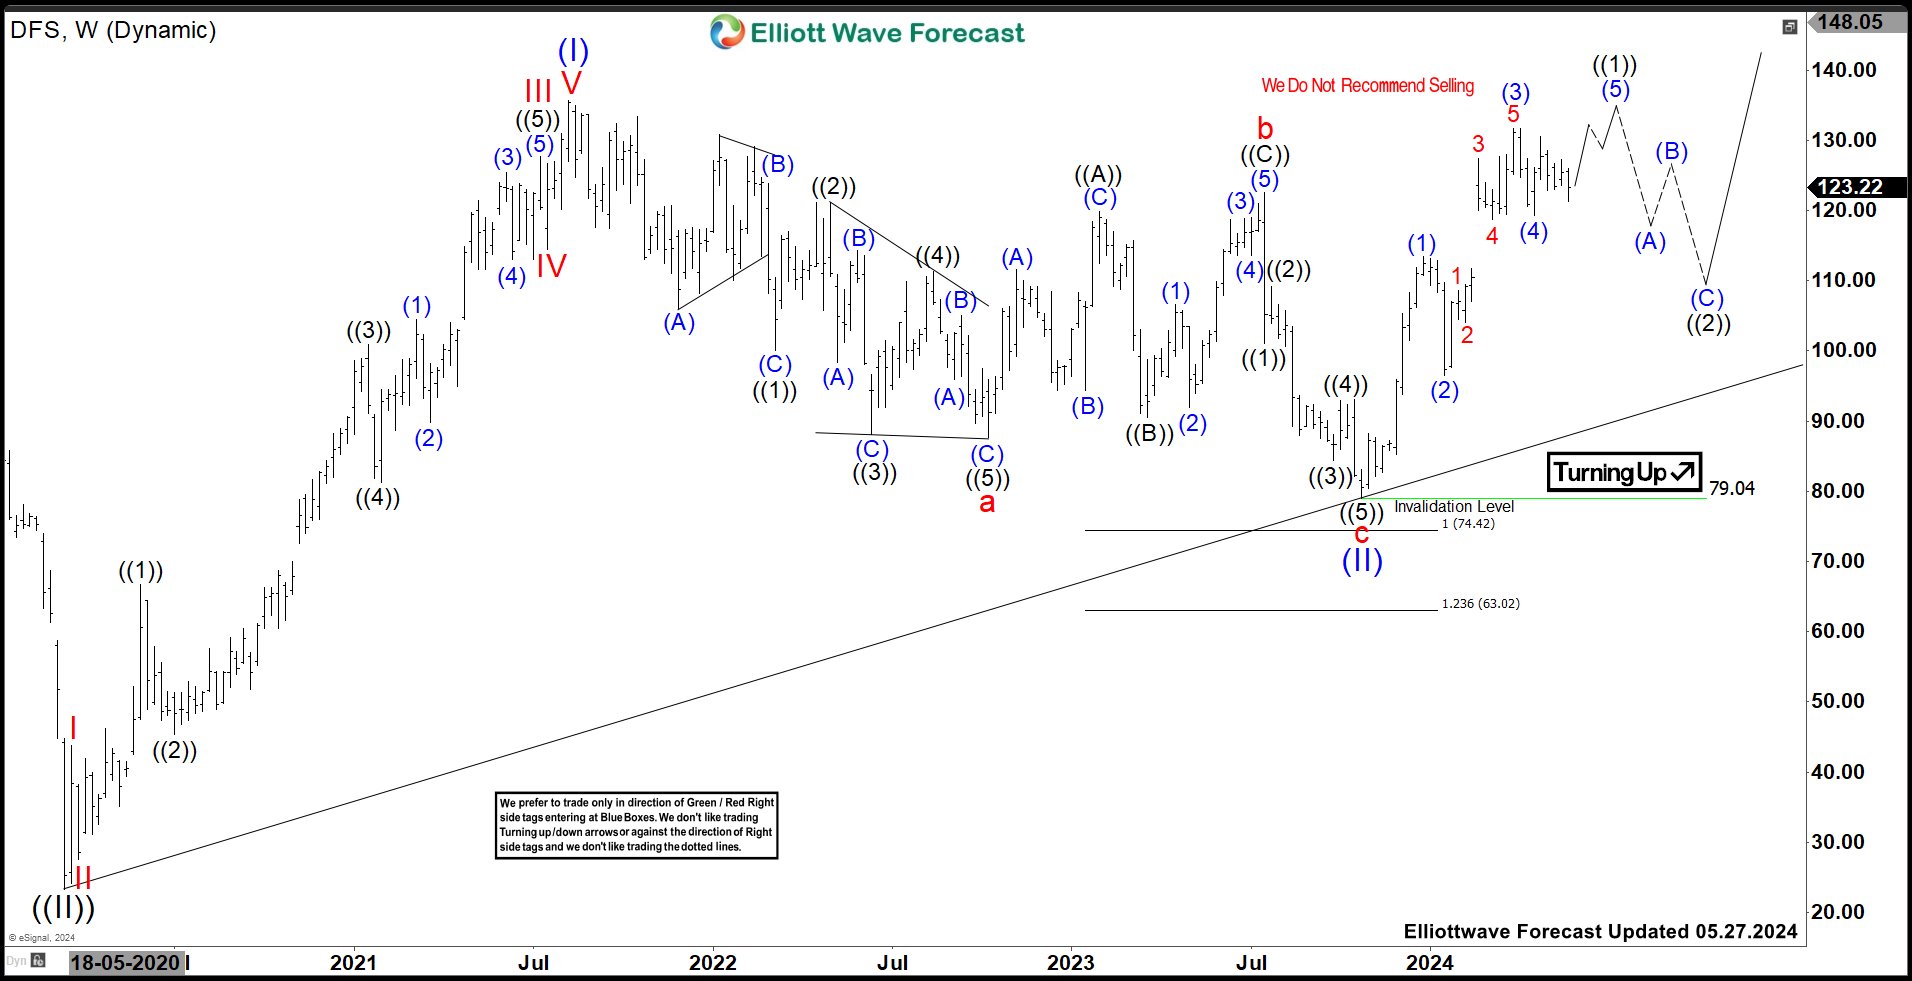
It ended ((II)) at $23.25 low in March-2020 low in weekly sequence. Above there, it placed (I) at $135.69 high in August-2021 as the part of ((III)). Within (I), it placed I at $43.82 high, II at $27.51 low, extended III placed at $127.65 high, IV at $114.37 low & finally V as (I) ended at $135.69 high. It ended (II) as zigzag correction at $79.04 low in October-2023. Within (II), it placed a red at $87.64 low as diagonal sequence & b at $122.50 high as flat. Below that, it ended c red as (II) at $79.04 low as 0.5 Fibonacci retracement of (I), which missed the extreme areas ($74.42).
Above (II) low, it favors upside in ((1)) of I of (III) & need to break above (I) high to confirm the bullish sequence for further upside. It placed (1) of ((1)) at $113.42 high, (2) at $96.45 low, (3) at $131.65 high & (4) at $119.31 low. It appears in (5) of ((1)), which confirms when it breaks above $131.65 high & may break above (I) high before any larger correction will starts in ((2)). Alternatively, it may pullback in (4) as double correction, if breaks below $119.31 low before turn higher in (5) of ((1)). We like to buy the next pullback in 3, 7 or 11 swings, once it breaks above (I) high. While below that level, it still can be remains sideways.
Source: https://elliottwave-forecast.com/stock-market/dfs-ready-next-move-higher/
