How Have Tech IPOs Performed in Their First Year – A Base Rate Analysis

Privately held tech companies have captured investors’ attention in recent years as their delayed initial public offerings have resulted in sometimes massive valuations. Yet, these companies are hard to analyze as generally they are growing quickly but incurring losses. Aneet Chachra, Portfolio Manager on the Diversified Alternatives team, analyzes some key metrics investors should consider.
Key Takeaways
- After much anticipation – and some would say delay – the technology IPO market is giving evidence of heating up.
- Forecasting the business of tech IPOs and share price performance is incredibly difficult. Consequently, assessing a fair value for their IPO price can be challenging.
- The variability of returns for a tech IPO is roughly three times greater than the broader market. Buying at the IPO deal price or before has generally been positive over the long term, but buying post-debut is taking the “inside view” that your forecast is more accurate than what prior tech IPO experience would initially suggest.
Privately held tech companies have captured investors’ attention in recent years as their delayed initial public offerings (IPOs) have resulted in sometimes massive valuations. Yet, these companies are hard to analyze as generally they are growing quickly but incurring losses. Forecasting their business and share price performance is incredibly difficult. Consequently, assessing what is a fair value for their IPO price can be a challenge.
A simpler starting point is base rate analysis – how have technology IPOs performed, on average, and what have been their observed characteristics? This forms the reference class and the historical range of outcomes make up the “outside view.” Using base rates as the initial estimate has been popularized in recent years by Philip Tetlock (“Superforecasting”) and Michael Mauboussin (“The Success Equation”).
Let’s build a reference class of all U.S.-listed tech IPOs launched between 2010 and 2018 with at least 12 months of trading history post-IPO. There are 220 companies that meet these criteria.
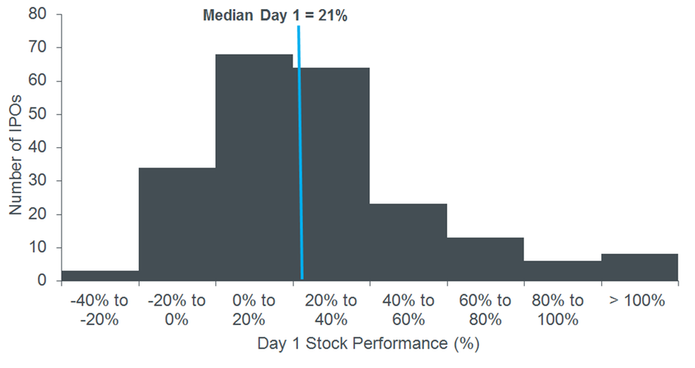
Notably, these deals have historically done very well out of the gate. Tech IPOs have risen on day 1 about 80% of the time, with a median day 1 performance of 21% (Exhibit 1).
Exhibit 1: U.S.-Listed Technology IPO Day 1 Performance
To analyze further, for each subsequent month we calculate median and the range of observed returns for this set of tech IPOs. In order to isolate IPO-specific performance, all of the return figures below are relative to the overall tech sector (calculated as long each IPO/short S&P 500 Information Technology Index for every month). This controls for the strong performance of tech over the last decade and appropriately compares IPOs launched at different times.
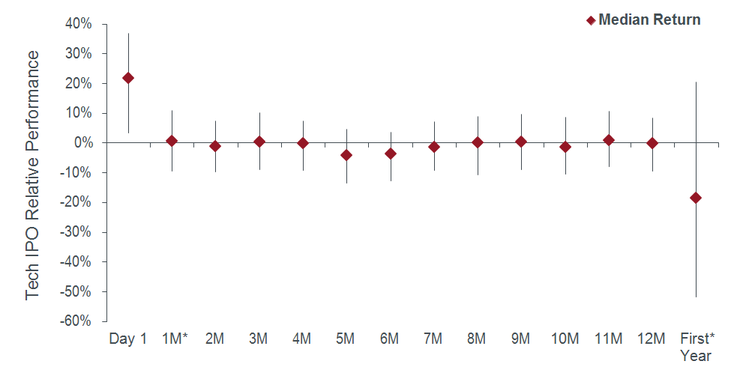
Exhibit 2 shows median day 1, by month, and first year relative returns for these 220 tech IPOs along with 25th and 75th percentile outcome ranges (the vertical lines). This provides a visual sense of the distribution of returns in addition to the median.
Exhibit 2: Tech IPOs’ First Year as a Public Company (Median and 25th/75th Percentile Outcomes)
There are two key takeaways to note when examining the reference class above.
The first is the period of underperformance in the middle of the first year (see months 5 and 6). This likely corresponds to anticipated and actual increase in share supply and selling pressure around the lockup expiration date (180 days post-IPO). Generally, employees and venture capital backers must wait for the IPO lockup period to end before they can sell their shares in the market and convert paper wealth into liquidity. Given that pre-IPO holders are often quite concentrated and need to diversify, they can be price insensitive and cause significant impact due to their selling flows.
The second is the average first-year return (excluding the day 1 performance) for a tech IPO is negative with a median -19% underperformance relative to the broader tech sector. To be clear, the range of observed tech IPO outcomes has been extremely wide ranging from a near wipeout to a quadrupling within a year. The variability of returns for a tech IPO is roughly three times greater than the broader market.
Overall, the average U.S. tech IPO has risen on its first trading day, but its relative return through the rest of its first year has been negative, with the bulk of the underperformance coming four to seven months after the firm goes public. This is the “outside view” without doing any analysis of the particular company. Buying at the IPO deal price or before has generally been positive over the long term, but buying post-debut is taking the “inside view” that your forecast is more accurate than what prior tech IPO experience would initially suggest.
The opinions and views expressed are as of the date published and are subject to change without notice. They are for information purposes only and should not be used or construed as an offer to sell, a solicitation of an offer to buy, or a recommendation to buy, sell or hold any security, investment strategy or market sector. No forecasts can be guaranteed. Opinions and examples are meant as an illustration of broader themes and are not an indication of trading intent. It is not intended to indicate or imply that any illustration/example mentioned is now or was ever held in any portfolio. Janus Henderson Group plc through its subsidiaries may manage investment products with a financial interest in securities mentioned herein and any comments should not be construed as a reflection on the past or future profitability. There is no guarantee that the information supplied is accurate, complete, or timely, nor are there any warranties with regards to the results obtained from its use. Past performance is no guarantee of future results. Investing involves risk, including the possible loss of principal and fluctuation of value.
Initial Public Offerings (IPOs) are highly speculative investments and may be subject to lower liquidity and greater volatility. Special risks associated with IPOs include limited operating history, unseasoned trading, high turnover and non-repeatable performance.
Investing involves risk, including the possible loss of principal and fluctuation of value.
Technology industries can be significantly affected by obsolescence of existing technology, short product cycles, falling prices and profits, competition from new market entrants, and general economic conditions. A concentrated investment in a single industry could be more volatile than the performance of less concentrated investments and the market as a whole.
The S&P 500® Information Technology Index comprises those companies included in the S&P 500 that are classified as members of the GICS® information technology sector.
C-0519-24027 05-30-20
The post How Have Tech IPOs Performed in Their First Year – A Base Rate Analysis appeared first on Janus Henderson Blog .
RSS Import: Original Source
