ElliottWave-Forecast has built its reputation on accurate technical analysis and a winning attitude. By successfully incorporating the Elliott Wave Theory with Market Correlation, Cycles, Proprietary Pivot System, we provide precise forecasts with up-to-date analysis for 50 instruments including FX majors, Gold, Silver, Copper, Oil, Natural Gas, Soybeans, Sugar ,Corn TNX and a number of Equity Indices from around the World. Our clients also have immediate access to our proprietary Actionable Trade Setups, Market Overview, 1 Hour, 4 Hour, Daily & Weekly Wave Counts. Weekend Webinar, Live Screen Sharing Sessions, Daily Technical Videos, Elliott Wave Setup videos, Educational Resources, and 24 Hour chat room where they are provided live updates and given answers to their questions. The guidance of ElliottWave-Forecast gives subscribers the wherewithal to position themselves for proper entry and exit in the Forex marketplace. We believe our disciplined methodology is pivotal for long-term success in trading.
Gold to Silver Ratio Has Started the Next Bearish Leg
With tense geopolitical situation between two world super powers, ongoing war, and banking crisis, there's no shortage of black swan events. Gold and Silver have performed very well in this environment. After 3 years of consolidation, they look to have formed major low earlier this year and ready for the next bullish cycle. We will look at the Gold-to-Silver ratio (AUG) which has an inverse correlation to the underlying physical Gold and Silver. In other words, when the ratio is going higher, both Gold and Silver go down. Conversely, when the ratio turns lower, both Gold and Silver go up in price. In both cases, Silver outperforms Gold in upside as well as downside. Let's see the latest daily outlook of AUG below.
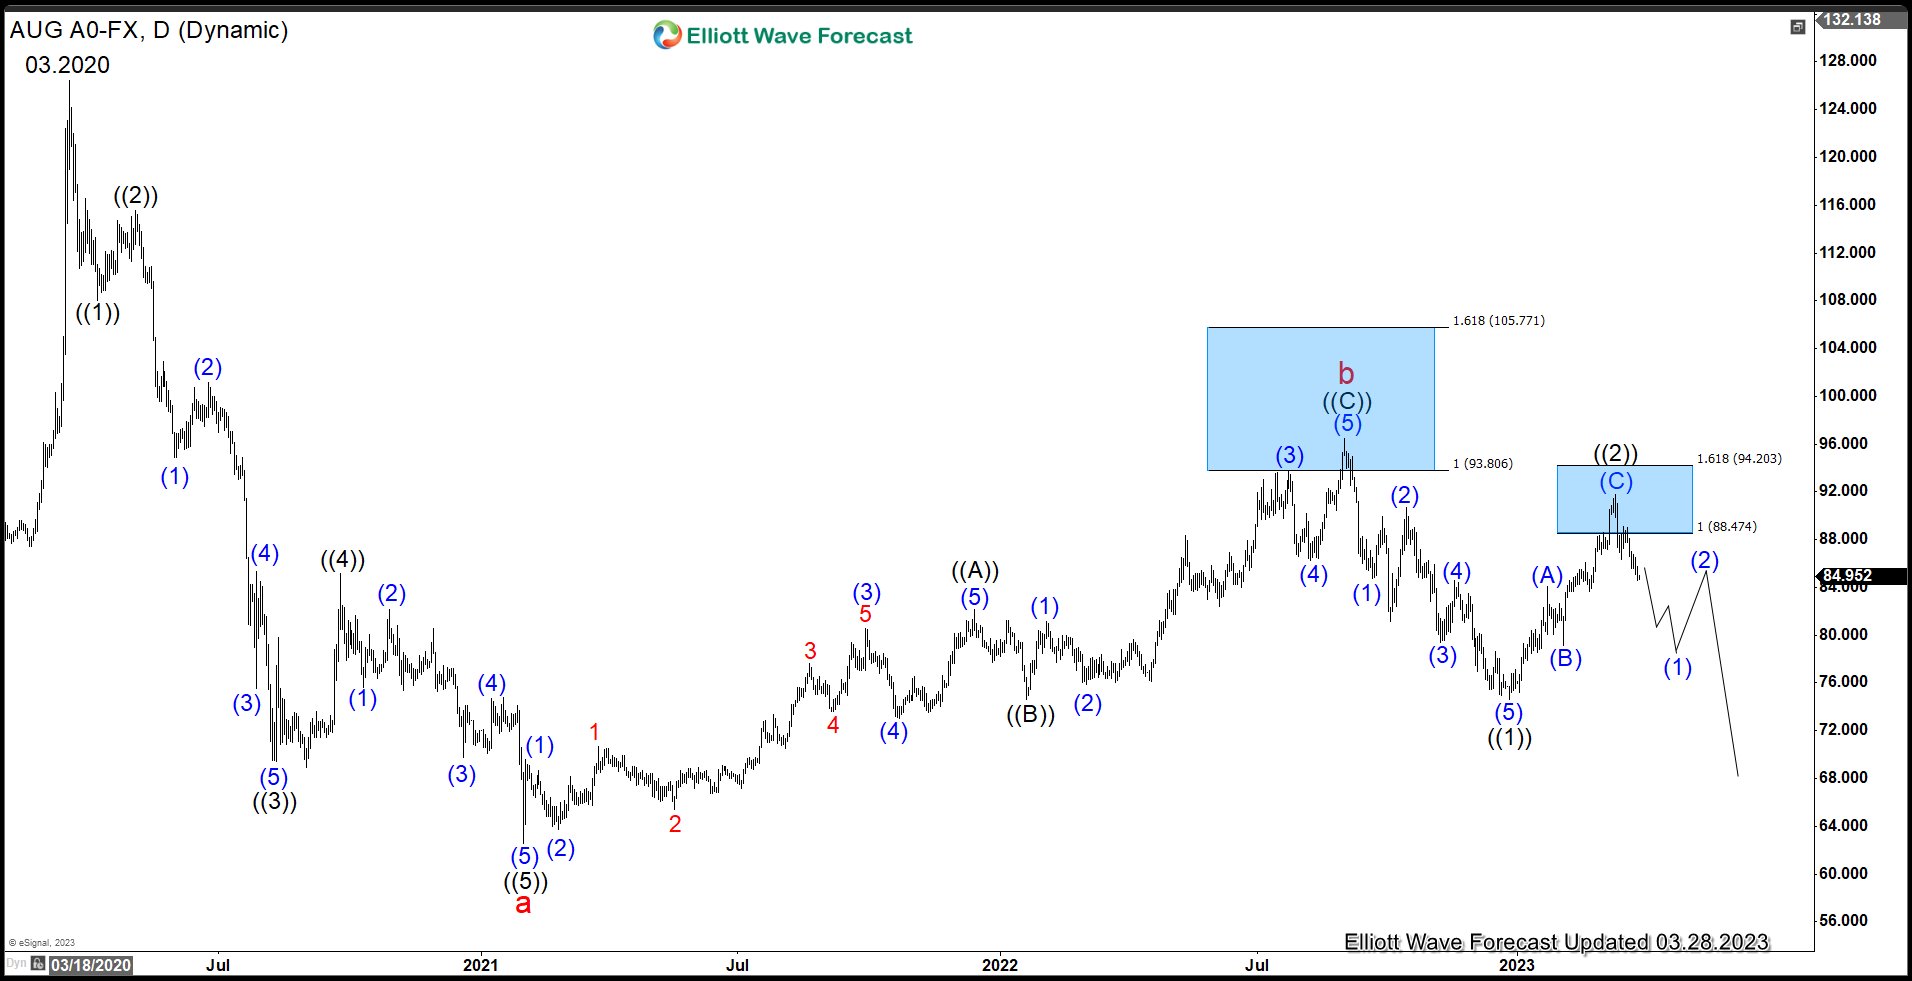
Gold to Silver Ratio Daily Chart
Gold-to-Silver ratio (AUG) daily chart above shows the decline from March 2020 high is in 5 waves impulse and ended wave a at 62.51. It then did a 3 waves zigzag corrective rally. Up from wave a, wave ((A)) ended at 82.13 and pullback in wave ((B)) ended at 74.65. Last leg wave ((C)) ended at 96.49 which completed wave b. It completed the corrective rally at the 100% - 161.8% fibonacci extension of wave ((A)).
The ratio has turned lower in wave C. Down from wave b, wave ((1)) ended at 74.63. Corrective rally in wave ((2)) has also ended at 91.81 as a 3 swing zigzag. It ended the correction also at the extreme blue box area. The ratio has turned lower and we should expect it to continue lower in months to come.
Source: https://elliottwave-forecast.com/commodities/gold-silver-ratio-started-next-bearish-leg/


