GBP USD made new high after Double Three correction
Hello fellow traders. In this technical blog we’re going to take a quick look at the past Elliott Wave chart of GBP USD published in members area of www.elliottwave-forecast.com . In further text we’re going to take a look at the structures,count the swings and explain the reasons why we called for the extension to the upside.
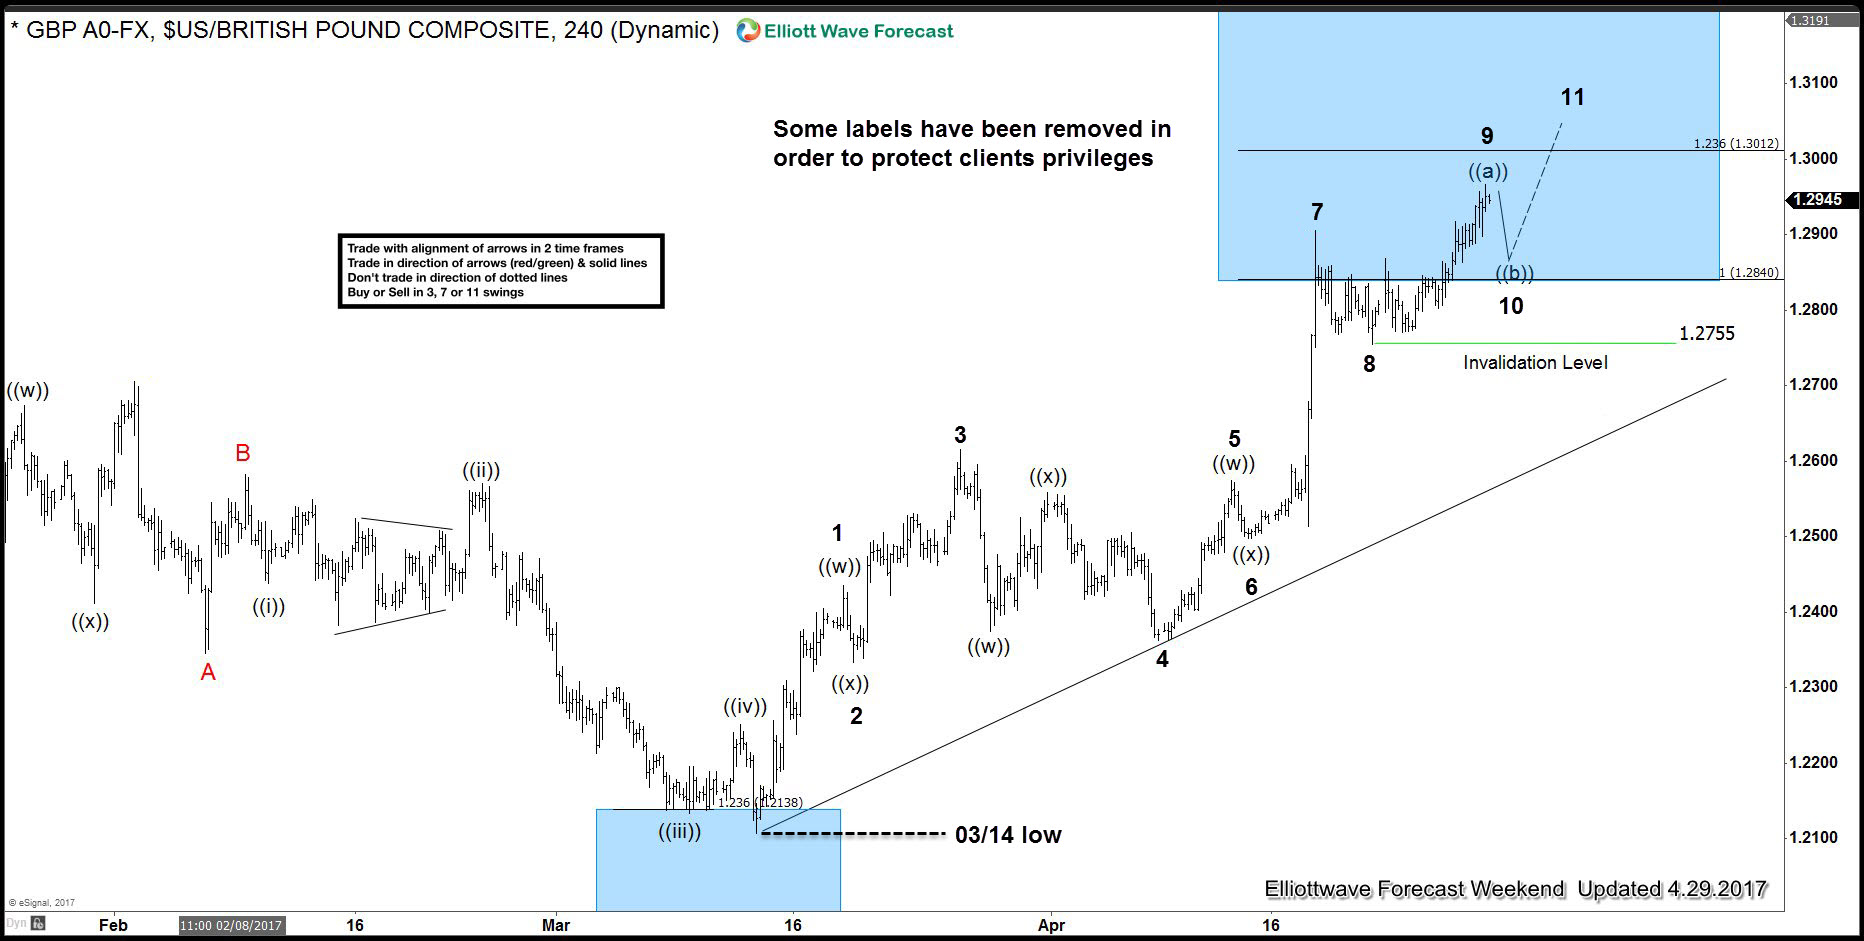
GBP USD Elliott Wave 4 Hour Chart 4.29.2017
As we can see on the chart below, rally from the 03/14 low is showing incomplete structure. GBP USD is currently showing 9 swings from the mentioned low, suggesting we should get another leg up, once short term ((b)) pull back complete. With proposed scenario we will get clear 11 swings structure. Although the pair has already reached the extreme area from the 03/14 low at 1.284-1.3801, we knew that extension is possible not only because of incomplete structure in GBP USD, but also because of incomplete bearish swing structure we have had in USDX from the 12/15 peak, calling for more weakness. As GBP USD is inversely correlated with Dollar index, we expect GBP USD to ideally stay supported until USDX reaches extremes in the mentioned cycle.
Now let’s take a look at the short term structure that has been unfolding during the next few days.
GBP USD Elliott Wave 1 Hour Chart 5.4.2017
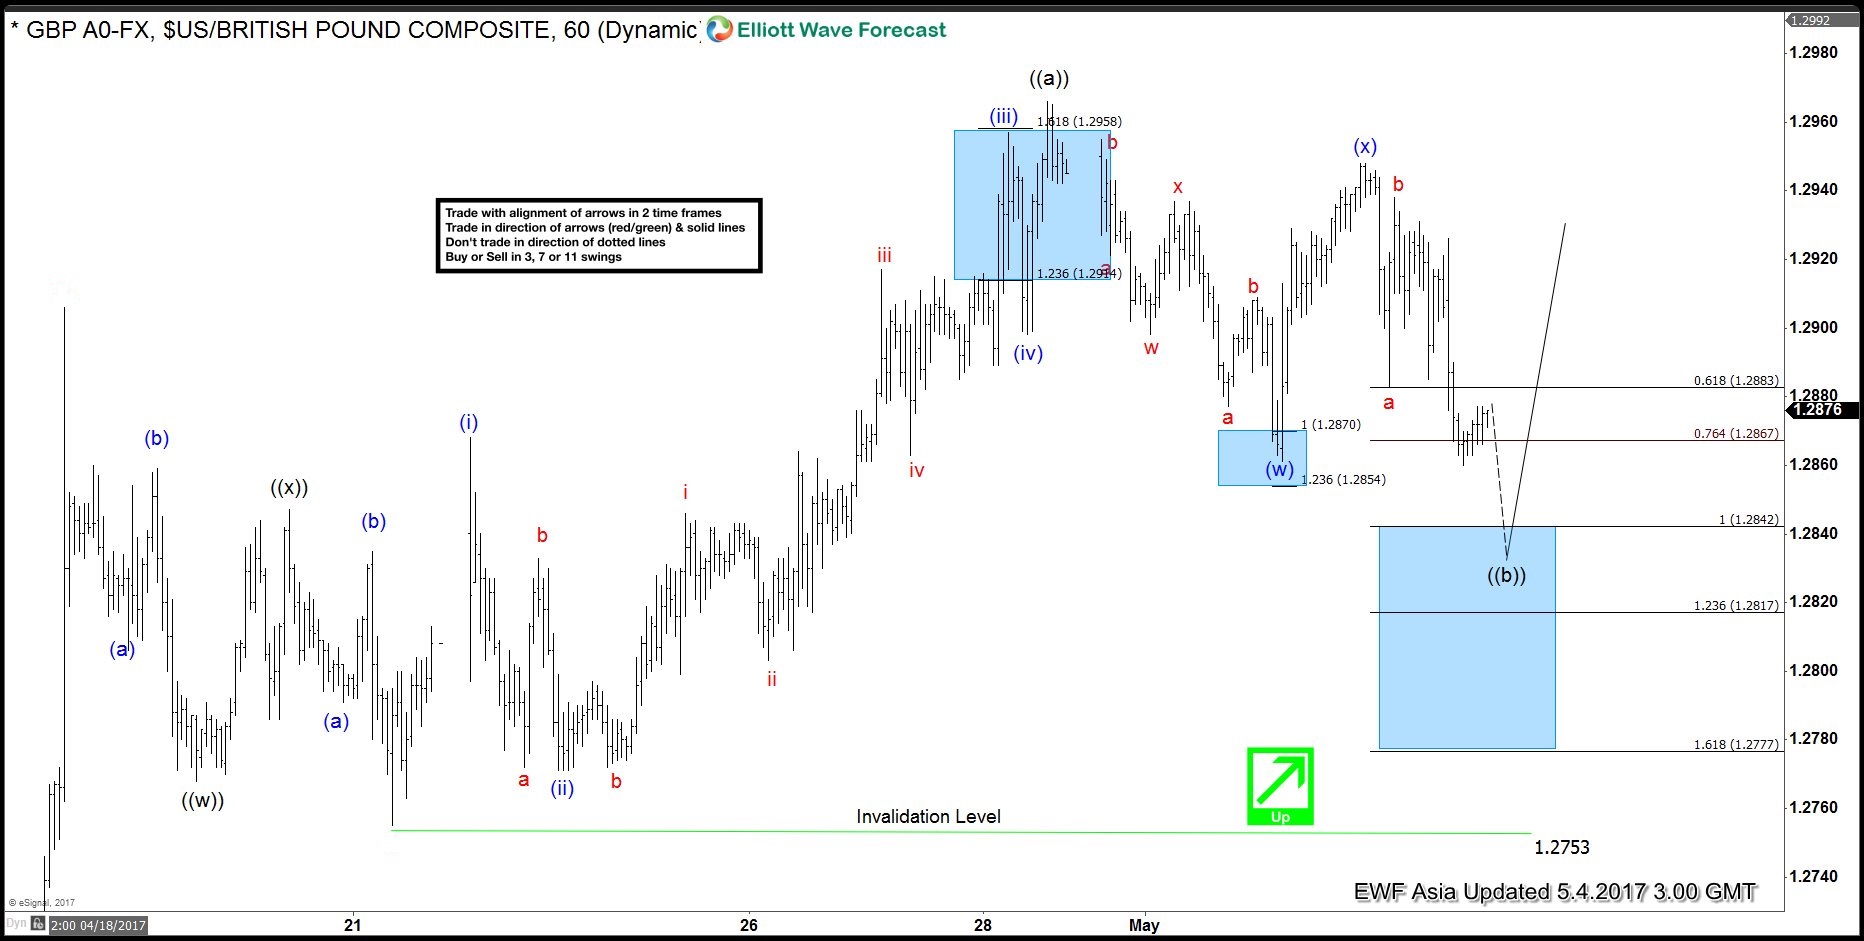
We got nice pull back in wave ((b)) as expected. Short term structure suggests ((b)) pull back is still in progress as Double three (w)(x)(y) structure .It should ideally make another push down and reach 1.2842-1.2817 area, before intraday buyers appear for another leg up.
Shortly after, GBPUSD reached 1.2842-1.2817 area as expected. It found buyers there as expected, make nice rally and eventually it broke above 04/28 peak , which is labeled on the chat as wave ((a)) .
Keep in mind market is dynamic. If you’re interested in the future path of GBPUSD or in any of the other 50+ instruments we cover, join us now. You can find Elliott Wave analysis in the
membership area
of EWF. If not a member yet,
Sign Up for Free Trial now
.
Elliott Wave Forecast
Through time we have developed a very respectable trading strategy. It defines Entry, Stop Loss and Take Profit levels with high accuracy and allows you to make position Risk Free, shortly after taking it, protecting your account. If you want to learn all about it and become a professional Trader, join us now for Free .
You will get access to Professional Elliott Wave analysis in 4 different time frames. 3 live Analysis Session done by our Expert Analysts every day. 24 Hour Chat Room support, Market Overview, Weekly technical videos and much more. Welcome to Elliott Wave Forecast.