ElliottWave Forecast
April 07, 2025
ElliottWave-Forecast has built its reputation on accurate technical analysis and a winning attitude. By successfully incorporating the Elliott Wave Theory with Market Correlation, Cycles, Proprietary Pivot System, we provide precise forecasts with up-to-date analysis for 50 instruments including FX majors, Gold, Silver, Copper, Oil, Natural Gas, Soybeans, Sugar ,Corn TNX and a number of Equity Indices from around the World. Our clients also have immediate access to our proprietary Actionable Trade Setups, Market Overview, 1 Hour, 4 Hour, Daily & Weekly Wave Counts. Weekend Webinar, Live Screen Sharing Sessions, Daily Technical Videos, Elliott Wave Setup videos, Educational Resources, and 24 Hour chat room where they are provided live updates and given answers to their questions. The guidance of ElliottWave-Forecast gives subscribers the wherewithal to position themselves for proper entry and exit in the Forex marketplace. We believe our disciplined methodology is pivotal for long-term success in trading.

Elliott Wave Forecast: Silver Miners ETF (SIL) Eyes a Double Correction Scenario

SIL (Silver Miners ETF) is a financial instrument crafted to track the performance of silver mining companies. It provides investors with a convenient avenue to tap into the silver market without the need to acquire physical silver or individual mining stocks directly. By distributing investments across various companies in the sector, SIL helps diversify risk, potentially serving as a buffer against fluctuations in silver prices. In this article, we will explore the Elliott Wave outlook for this ETF.

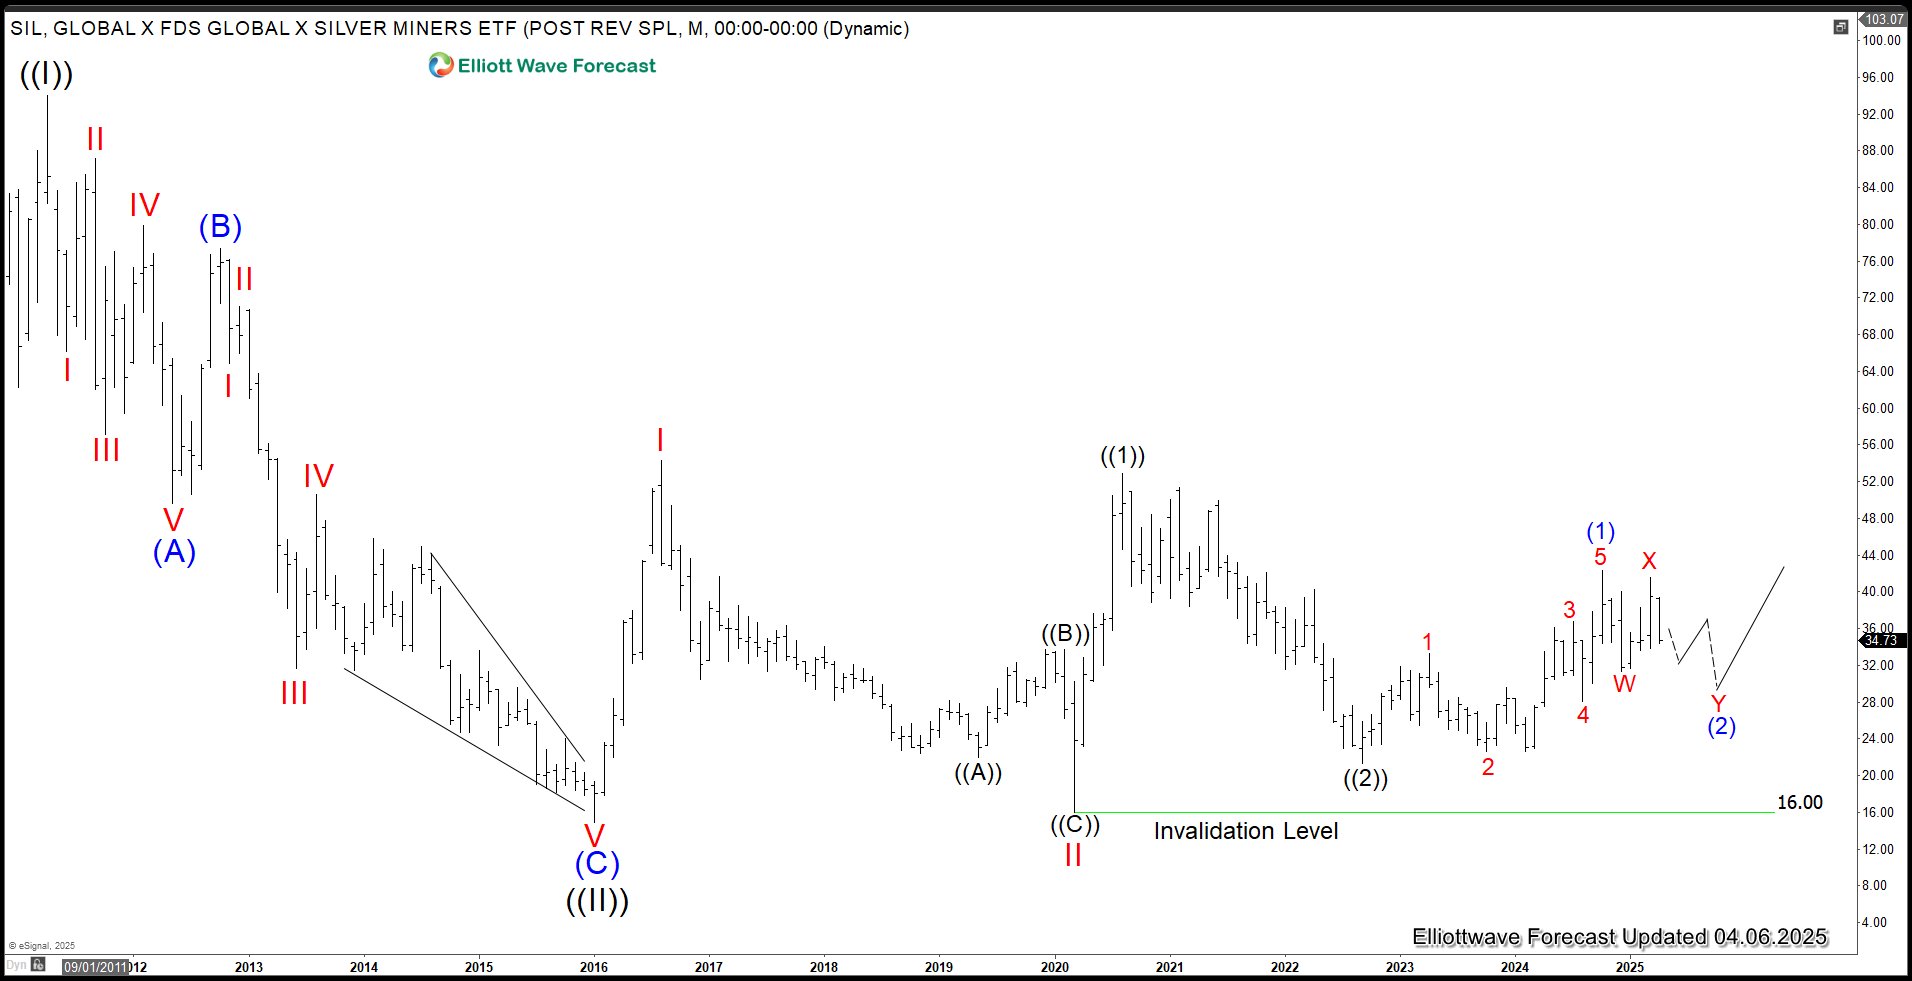
SIL (Silver Miners ETF) Monthly Elliott Wave Chart

The monthly Elliott Wave chart for Silver Miners (SIL) shows that the ETF hit a major low of 14.94 in 2016, marking the end of a long-term cycle. Since then, it’s been climbing steadily in an upward trend. From that 2016 low, it surged to 54.34 before pulling back to 16. After that dip, SIL took off again, reaching 52.87, followed by another drop to 21.26. More recently, it rallied to 42.29, and now it’s in the middle of a pullback that started after its September 2022 low. This dip is part of a bigger pattern, and as long as it stays above 16, buyers are likely to step in during this correction, setting the stage for the next move higher.

Silver Miners ETF Daily Elliott Wave Chart

Silver Miners ETF (SIL) Elliott Wave Chart

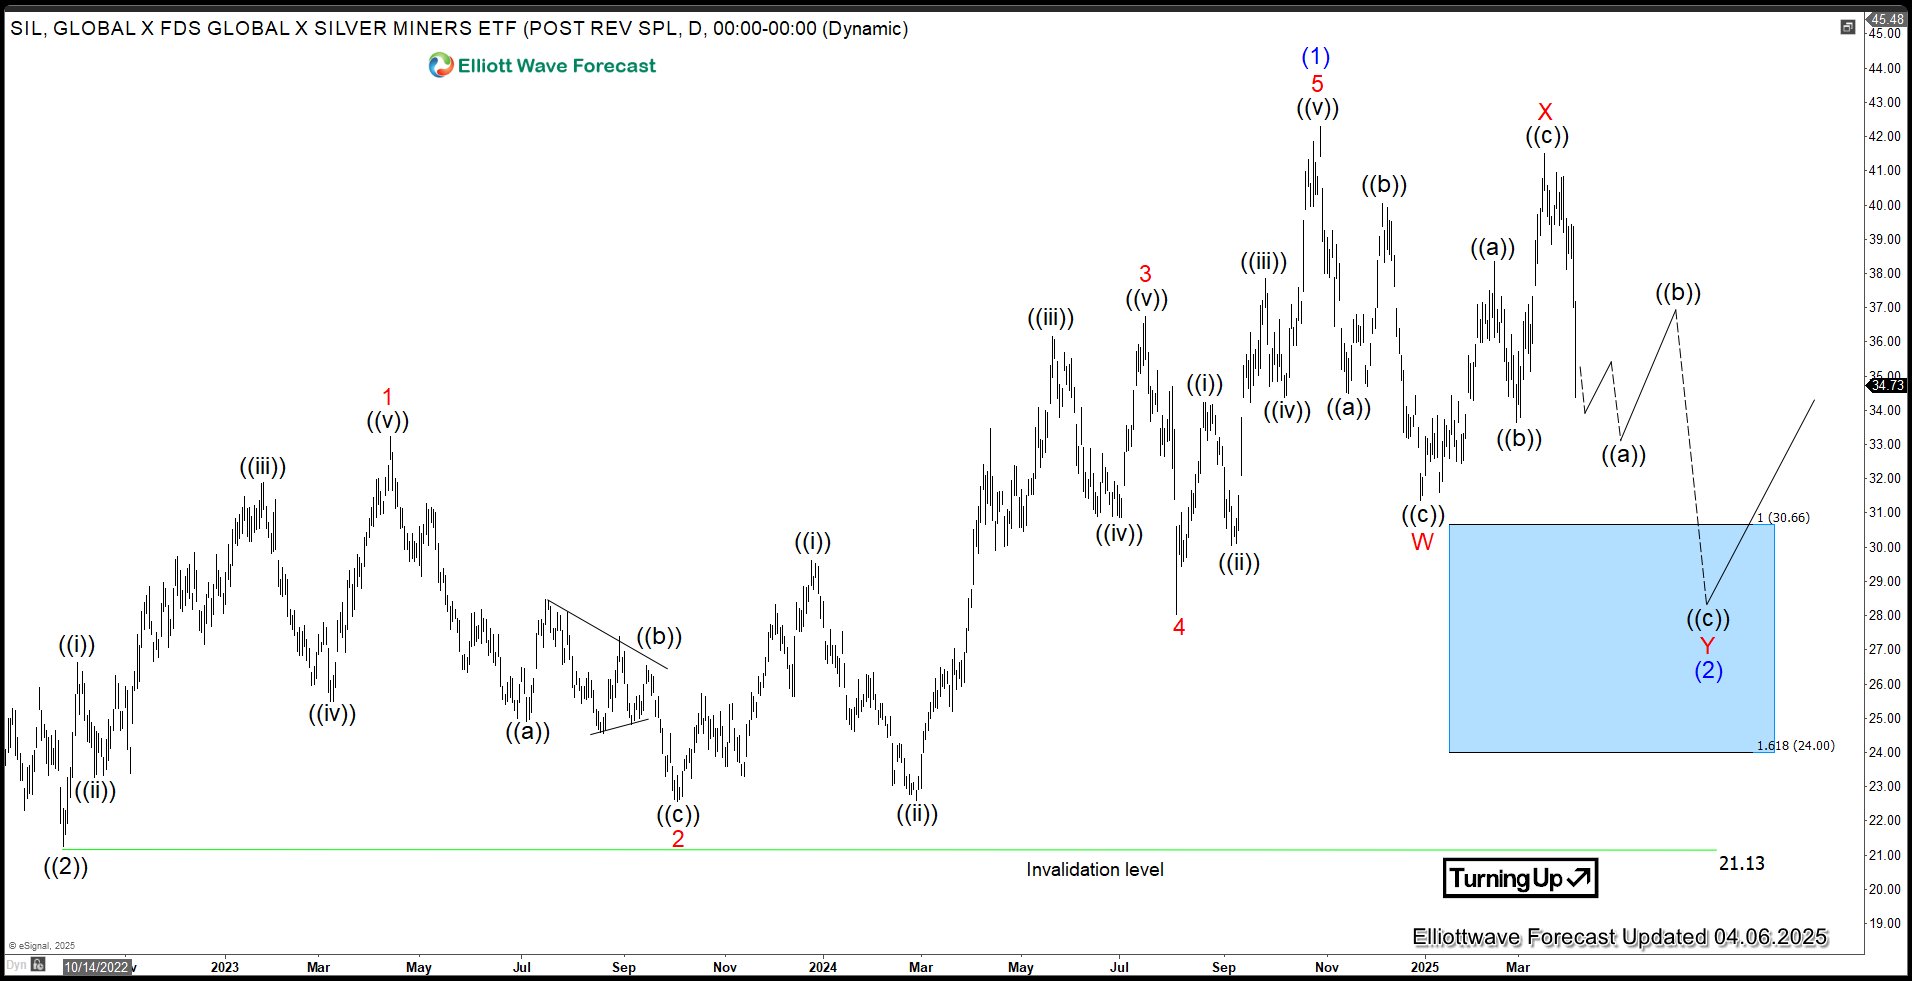
The daily chart for the Silver Miners ETF (SIL) shows that a pullback hit its low at 21.13 in September 2022. From there, the ETF started climbing in a clear five-step rally in diagonal form. It first rose to 33.24, dipped to 22.57, then pushed higher to 36.75. After a drop to 28.02, it made one final leap to 42.29, wrapping up the first big upward move. Now, it’s in the middle of a pullback that began after that September 2022 low, with a potential landing spot between 24 and 30.6—marked as the blue box area. As long as it holds above 21.13, buyers are likely to step in around 24 to 30.6, setting up the next climb.

Source:  https://elliottwave-forecast.com/stock-market/silver-miners-etf-sil-looking-double-correction/ 

More from ElliottWave Forecast
The most important insight of the day
Get the Harvest Daily Digest newsletter.