Axioma is the leading provider of innovative risk-management, portfolio-construction, and risk and regulatory reporting solutions.
Crowded Trades Don’t Explain Managers’ Recent Pain
Many managers have taken a beating since early November and some attribute the widespread losses to the unwinding of crowded trades by managers who tightly control their risk exposures. But there is no evidence of that in the returns to Axioma style factors on which many investors tilt.
With few exceptions, recent returns for most factors fell well within expected levels. While there may seem to be a high number of outliers, many would have helped investors, because they would have been likely to tilt their portfolios in the appropriate direction. This stands in sharp contrast to, say, August 2007, when many factors across most regions saw returns that were many standard deviations away from their long-term averages.
Overall, if there were a general unwinding of factor-based positions, we would expect to see much larger factor returns and/or returns in the opposite direction expectations.
So, what has been driving the negative returns? We see at least four reasons that may have contributed.
- Another way that investors use factors is to go long the most attractive stocks and short the least attractive. These “quintile spread” portfolios, may take large industry and other style factor bets, which in turn have a big impact on returns.
- Unexpectedly large factor returns in factors typically expected to have returns close to zero
- A sharp increase in market volatility
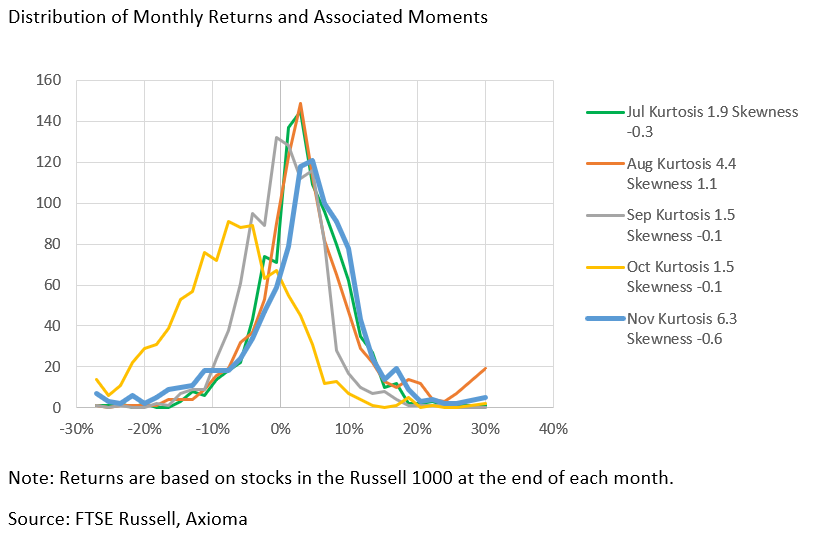
- Fat-tailed and skewed returns in November
Quintile Spread Portfolios
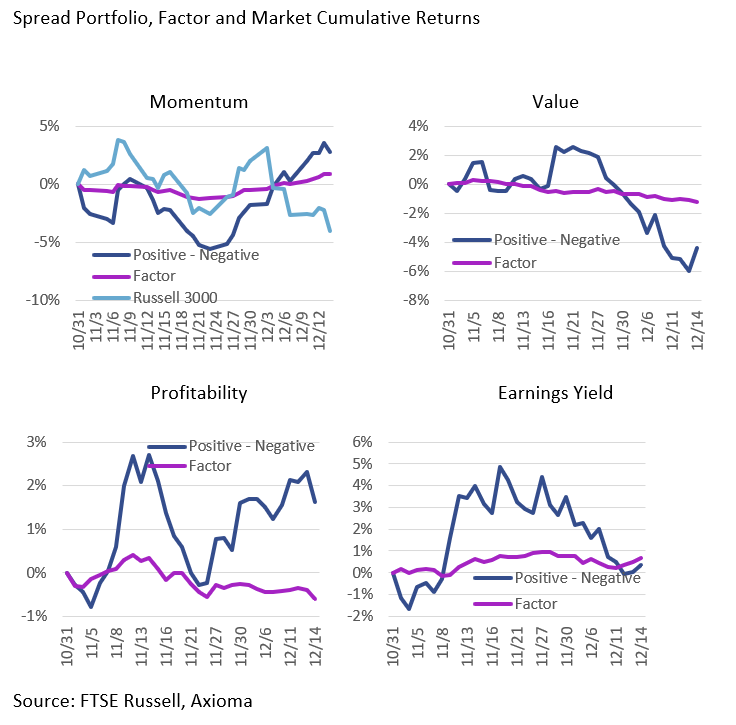
We created portfolios comprising the top and bottom quintiles of some factors in our US4 model. Cap-weighted returns for the spread portfolios were of larger magnitude and much more volatile than returns of the underlying factors, with the spreads experiencing significant drawdowns during at least a portion of the last six weeks, even if the factor return was steadier.
Throughout October the Momentum drawdown was large. Since early December, however, the Momentum spread portfolio (and the Momentum factor) has continued to rise, although the market has retreated. Over this period, the large daily returns, the turnover in the positive and negative Momentum stocks, and the change in correlation of the return with the market likely made it tough for a Momentum-based investor to negotiate the volatility, even though the factor has recovered. Performance of the Momentum spread portfolio was boosted by negative exposures to Value and Volatility, along with a positive exposure to Size. Industry exposures also helped, especially a very large exposure to Software. At the same time, performance was dragged down by large negative stock-specific return.
In contrast to Momentum, Value returns were better earlier in the period under study, and only started to fall apart as we approached December. This provided some diversification benefit for managers using a multi-factor approach, as the spread returns between Momentum and Value were quite negatively correlated. Attribution of the Value spread portfolio clearly shows that exposure to the Value factor was a big drag on return, but industry exposures—especially a huge overweight in Banks—dragged down returns even more than the exposure to Value.
The return to the Profitability -spread portfolio was positive over this period, but the rapid return surge and subsequent drawdown in November was probably difficult to negotiate. More recently the spread portfolio has produced a positive return, whereas the factor return was negative. The spread portfolio’s exposure to profitability therefore obviously reduced returns, as did industry exposures (with a big overweight in Computer Hardware and underweight in Biotech hurting the most). But those drags were offset by a positive exposure to Size and negative exposures to Value and Volatility.
The Earnings Yield , factor return was positive, and the Spread return staged a huge round-trip, surging in November but falling apart and giving most of the return back in December. Once again, industries and other style exposures had larger impacts on return than the exposure to Earnings Yield. Biotech’s (negative) and Banks’ (positive) very large exposures both hurt returns substantially, whereas positive exposures to Size and Value, and negative bets on Market Sensitivity and Volatility, buoyed the portfolio.
Perhaps These Factors Needed a Bit More Attention
A few other factors—ones that investors often do not pay enough attention to—saw larger-than-expected returns earlier this year, as well as during the November-December period currently under scrutiny. Most notable were Size and Liquidity in the US Small Cap model, Size in Europe and Exchange Rate Sensitivity in several regions, all of which had returns that were at least two standard deviations away from their long-term averages
One of the Biggest-Ever Increases in Volatility
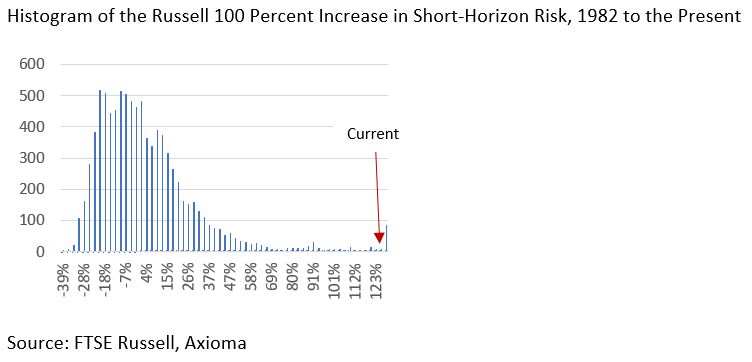
Market volatility has more than doubled since its recent low in early October, and that is one of the largest increases since the beginning of our US4 model in 1982. On top of the difficulty this leads to in terms of how to decide when and what to trade, this likely also meant that transaction cost models and trading algorithms underestimated the impact of trading.
Recent Returns Were Skewed and Fat-Tailed
Higher dispersion can be good for managers. However, if the distribution of returns is skewed and/or fat-tailed, a bad bet can have bigger-than-usual consequences. November clearly stood out from the prior four months with a bigger negative skew and much fatter tails. Eyeballing the chart suggests that the tails were fatter on the left side of the distribution.
Conclusion
Our analysis of factor returns over the past six weeks points away from the notion that unwinding crowded trades drove sharp underperformance, as most factors in most regions have “behaved” as expected. A panic for the exits would have meant a reversal of expected, and very large, returns.
We believe that the underperformance was more likely the result of sharply higher volatility, which made it quite difficult to be nimble enough and probably heightened trading costs, along with skewed and fat-tailed return distributions, both of which made the penalty to poor bets even bigger than usual. In addition, using quintile spreads for factor definitions possibly led to portfolios with big unintended bets that ate the potential alpha. Read the full analysis here .


