Costco Wholesale Corp. $COST Can Decline 25% Before Providing a Buying Opportunity
Hello Traders!
Today, we’ll take a closer look at the weekly Elliott Wave structure of Costco Wholesale Corp ($COST) and discuss why the current pullback may present an upcoming buying opportunity.
5 Wave Impulse Structure + ABC correction

$COST Weekly Elliott Wave View April 8th 2025:
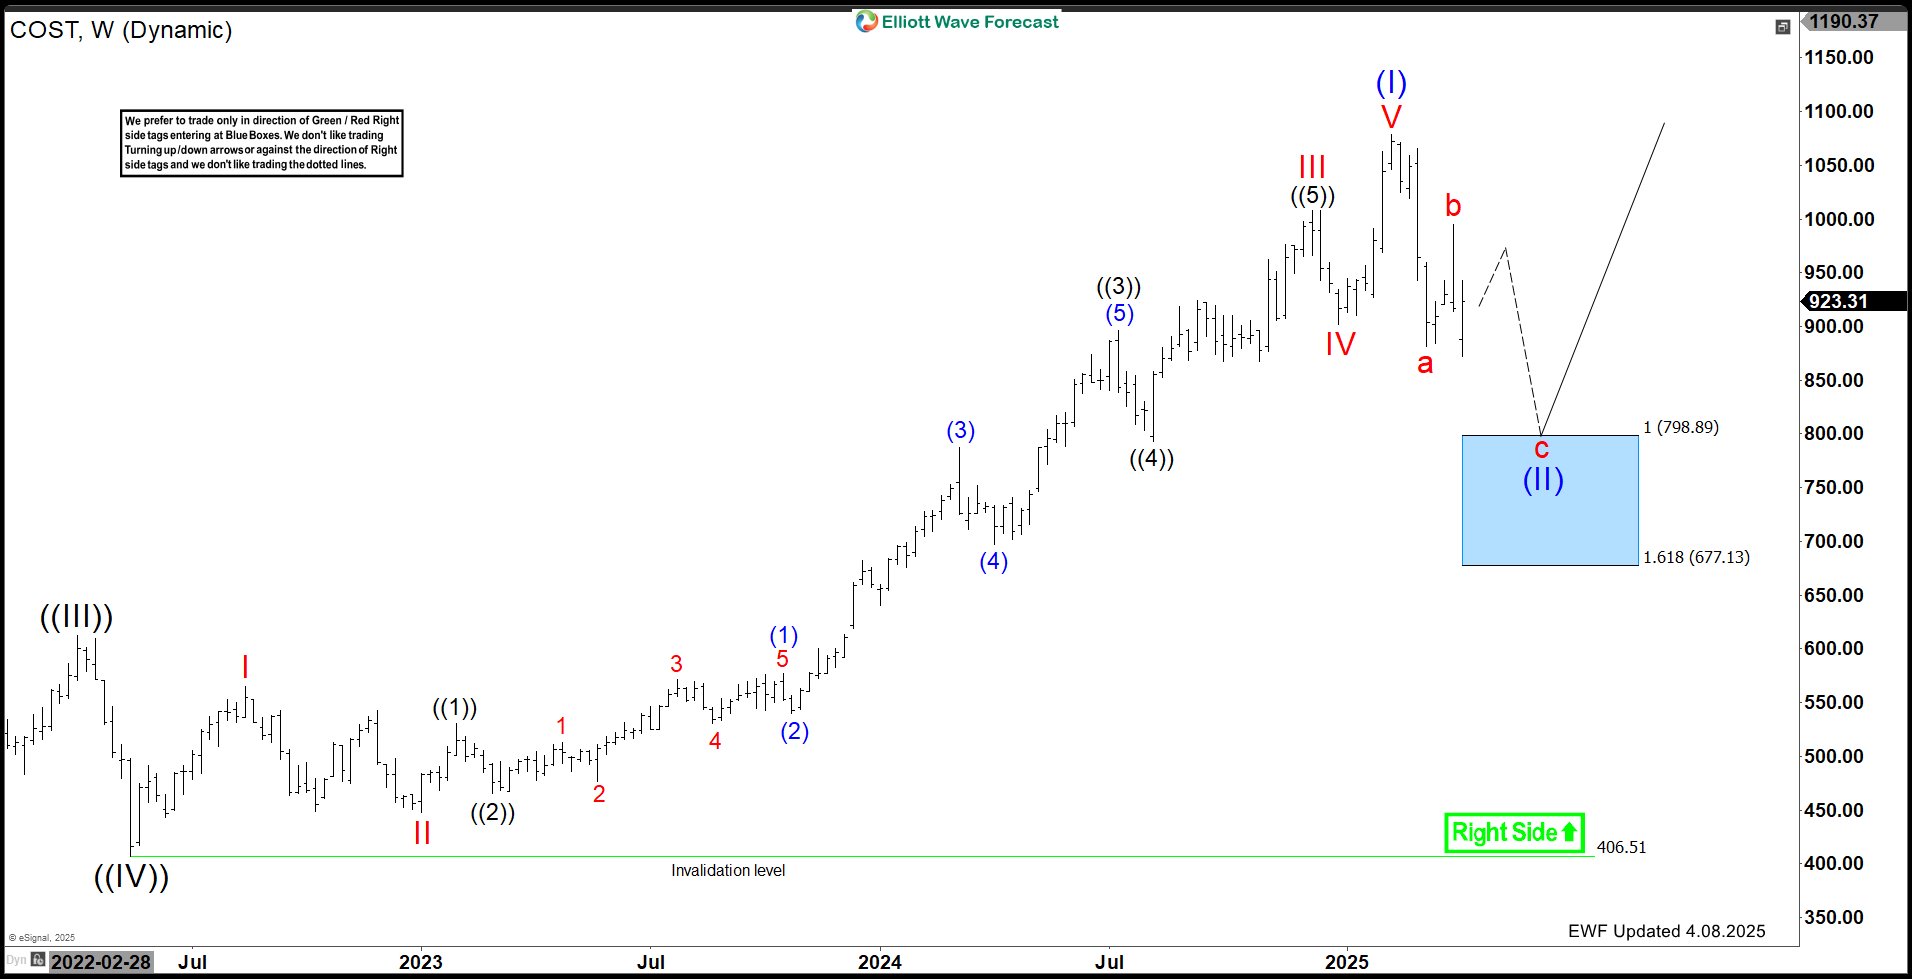
As expected after a strong impulsive move, the stock has been correcting lower in a zig-zag (ABC) structure , which is a common Elliott Wave corrective pattern. This pullback is now approaching a key Blue Box area, where buyers are anticipated to step in and initiate the next leg higher in wave (III) .
Key Technical Levels to Watch
- The Blue Box target zone for the correction is between $798.89 – $677.13 .
- As long as price remains above $406.51 , the bullish outlook remains valid.
- A confirmed reaction from this zone could set the stage for the next rally toward new highs.
Trading Strategy & Risk Management
While we expect the stock to move lower into the Blue Box , traders should be cautious about shorting the final leg of the decline. Truncations can occur at this stage, meaning the stock may reverse earlier than expected.
Corrections can unfold in 3, 7, or 11 swings , so risk management is crucial. If $COST bounces from the Blue Box, it may still extend lower in a double zig-zag (WXY) structure before a sustainable rally. That’s why we recommend booking partial profits and getting risk-free once the stock reacts positively from the support zone.
Conclusion
Costco's current pullback is nearing a critical support level. If price holds above the invalidation level at $406.51 , the stock is expected to resume its bullish trend in wave (III) . Traders should watch for buying opportunities as sellers begin to exhaust and the market sets up for another move higher.
Source: https://elliottwave-forecast.com/video-blog/costco-wholesale-corp-cost-can-decline-25-providing-buying-opportunity/
