COST (Costco Wholesale) Should Pull Back Before Rally Resume
Costco Wholesale Corporation., (COST) engages in the operation of membership warehouse in the United States, Puerto Rico, Canada, United Kingdom, Mexico, Japan, Korea, Australia, Spain, France, Iceland, China & Taiwan together with its subsidiaries. It offers branded & private-label products in the range of merchandise categories. It also operates e-commerce websites in the US, Canada, UK & many other countries. It is based in Issaquah, Washington, comes under Consumer Defensive sector & trades as “COST” ticker at Nasdaq.
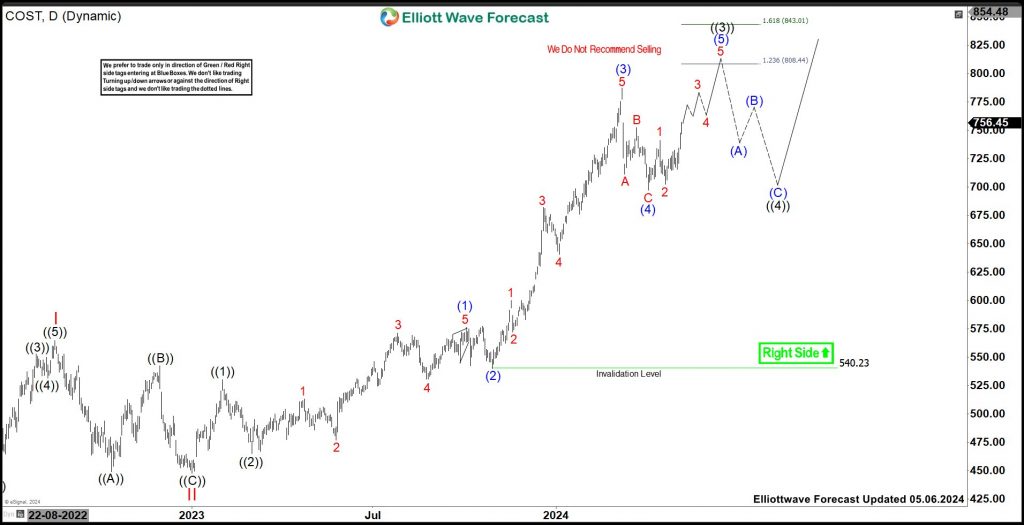
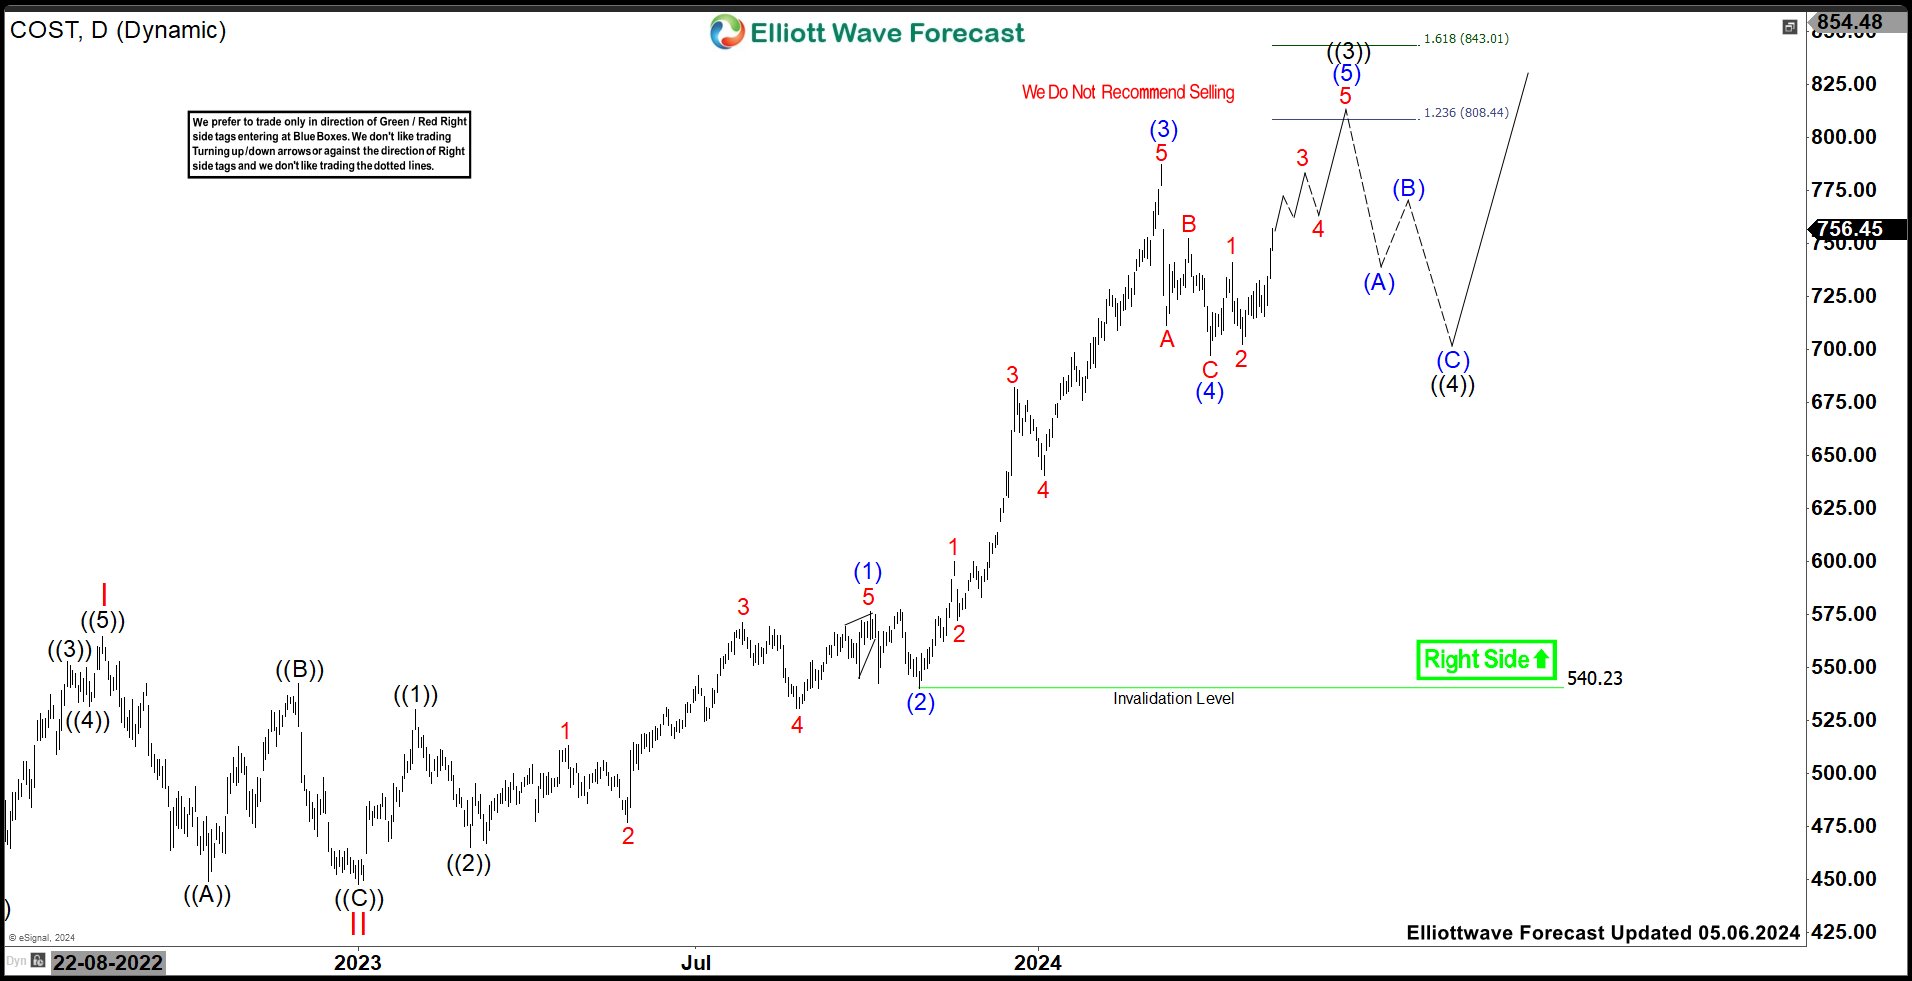
As discussed in last article, COST finished ((3)) sequence started from $697.27 low, which ended at $896.67 high. Currently, it favors corrective pullback towards $782.04 - $737.32 area, where it should find support to turn higher.
COST - Elliott Wave View From 5.06.2024:
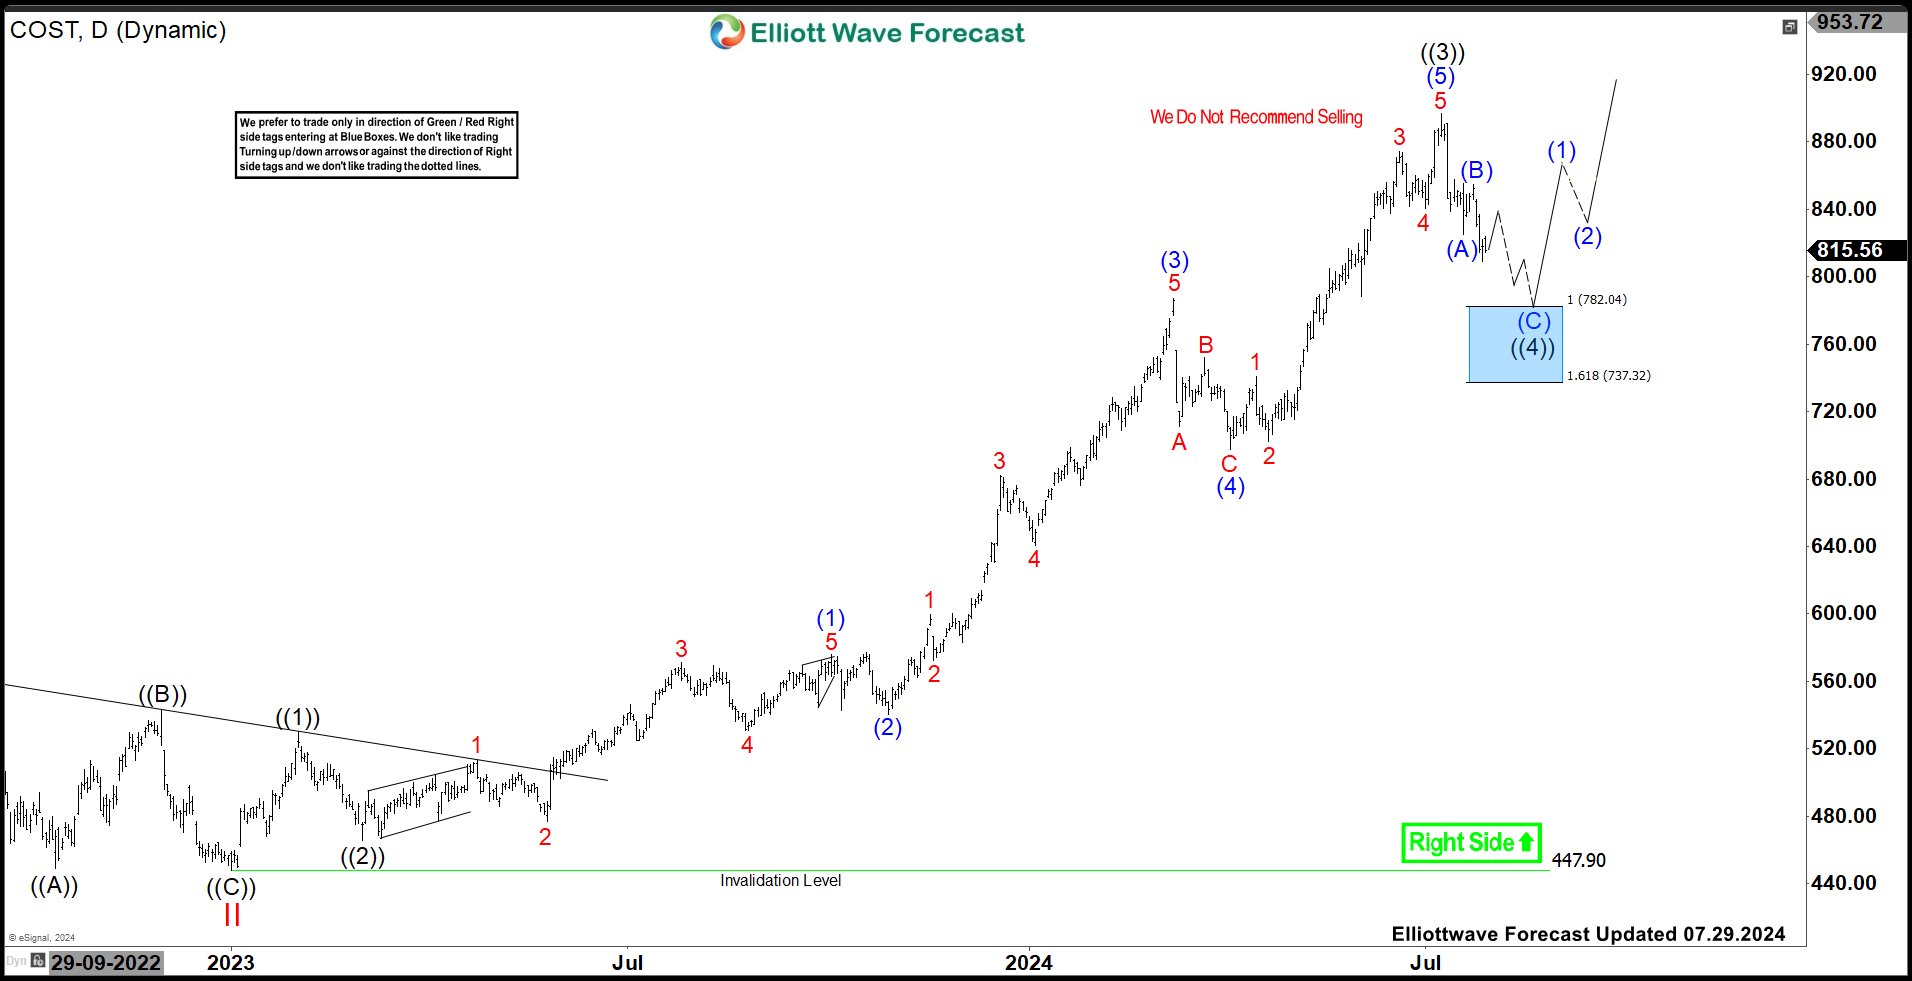
In Weekly sequence, it placed ((I)) at $612.27 high in April-2022 & ((II)) pullback at $406.51 low in May-2022. It already broke above ((I)) high, calling for upside in ((III)) in weekly bullish sequence. It placed I of (I) of ((III)) at $564.75 high & II pullback at $447.90 low in January-2023. Above there, it placed ((2)) pullback of III at $465.33 low in March-2023 & ((3)) at $896.67 high as extended wave .
COST - Elliott Wave Latest Daily View:

Within ((3)), it placed (1) at $576.19 high, (2) at $540.23 low, (3) at $787.08 high, (4) at $697.27 low & (5) at $896.67 high. Currently, it favors pullback in ((4)) as proposed zigzag & expect weakness towards $782.04 - $737.32 area, where buyers expect to enter the market. It placed (A) at $825.11 low & (B) at $854.58 high. Below there, it should extend lower to finish the ((4)) correction. We do not recommend selling it in any pullback. We only like to buy, if it reaches the blue box area. Alternatively, if it breaks above $854.58 high, then it may extend higher in ((5)).
COST - Elliott Wave Latest Weekly View:

Source: https://elliottwave-forecast.com/stock-market/cost-pull-back-rally-resume/
