
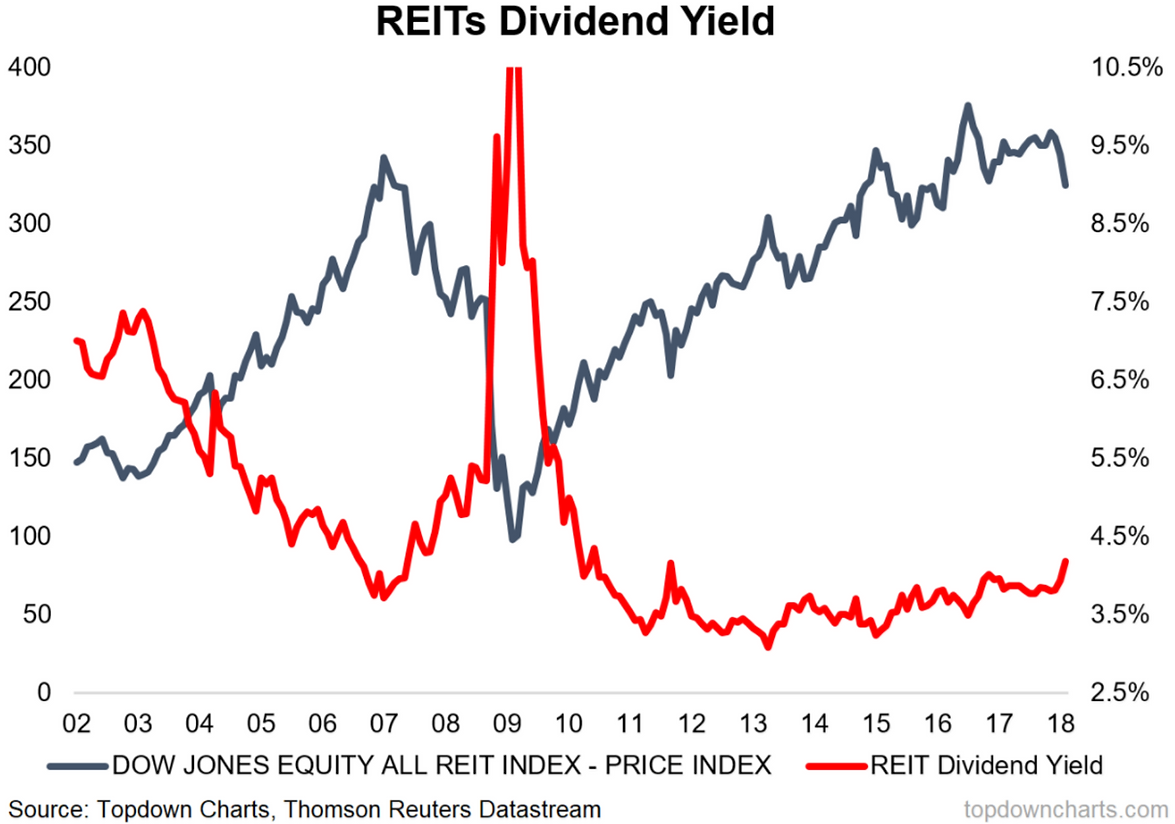
Chart Of The Week: US REIT Dividend Yields
US REITs have been double-hammered by the rise in bond yields and equity market correction. Since peaking in August 2016 the Dow Jones REIT index fell -17%. By way of comparison, the S&P500 index *rose* +19% over the same time period (even after the 10% correction), which represents a miserable -36% underperformance. It did gain some respite however, 'only' falling -9% vs -10% for the S&P500 during the correction so far.
One positive out of that though is that the index dividend yield has risen to the highest point since the 2011 correction (which in hindsight proved an opportune buying time).
As we know (just look at the 2008 experience) cheap things can get cheaper, and dividend yields can move higher during sustained down moves and bear markets. Given that our base case is that bond yields move higher , and lingering uncertainty around the equity market, it is possible that REITs could come under further pressure.
While REITs are often thought of as a defensive asset, in this environment that has only proven partially true, and should a deeper downturn in equities take hold there will be no hiding in REITs.
However spikes in dividend yields like the one we are seeing now have in the past proven good tactical buying opportunities. So while a better opportunity to allocate to REITs may come, the case is slowly building.