
Chart of the Week - Global Equity Market Regime Change
Bubble-Bursting Bear-Market: The major drivers of strength in global equities since the market bottom in 2009 (and ensuing decade-long bull market) namely: momentum/growth/cyclicals have taken a clear and decisive turn for the worst since peaking in early 2021.
Just as this group was a key driver of strength during the bull market phase, they are now a key driver of weakness during this apparent bear market phase.
Aside from the interesting parallels to the dot com bubble peak and subsequent burst (which also shared similarities with regards to stretched valuations and excess speculation), the main point or driver this time is the decade of monetary stimulus — and in particular the final phase: aka the pandemic stimulus tsunami.
Now that monetary stimulus is being withdrawn globally , the speculative tides are going out, and this chart is perhaps one of the most exquisite representations of the current equity market regime.
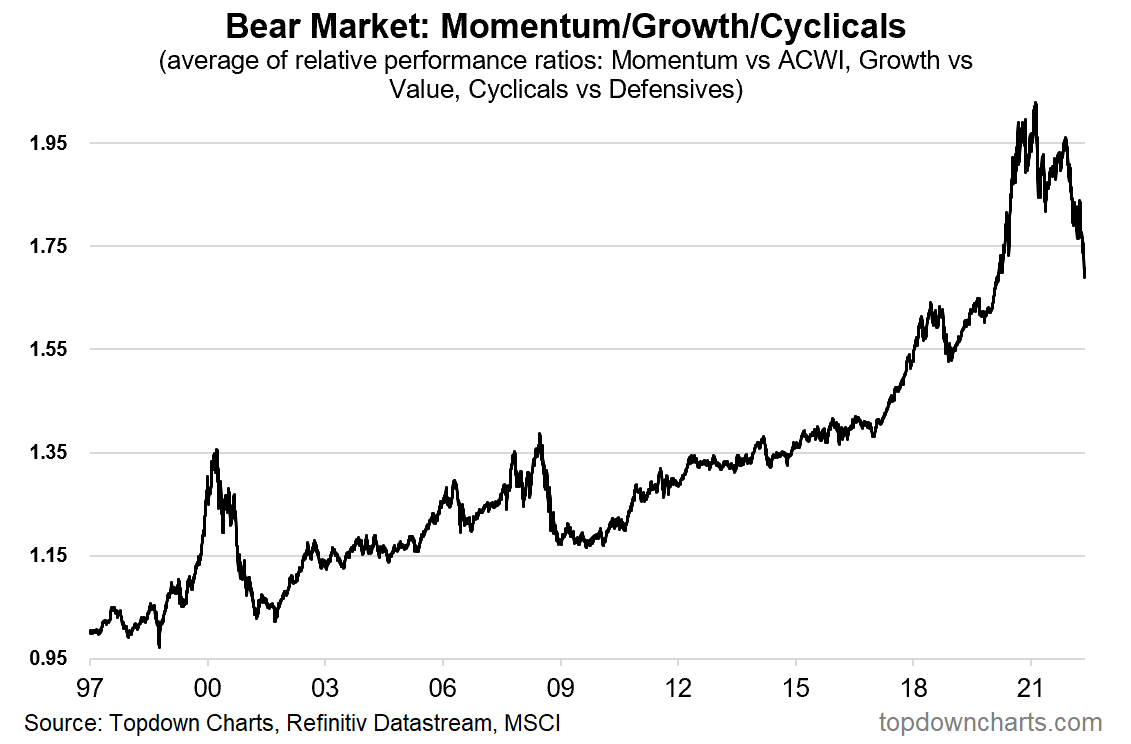
Key point: The bubble in growth/momentum/cyclicals is bursting.
NOTE: this post first appeared on our NEW Substack
Best regards,
Callum Thomas
Head of Research and Founder of Topdown Charts
Follow us on:
