
Change in China’s Credit Mix
China’s credit mix underwent changes in August, reflecting the recent policy fine-tuning. India’s downside inflation surprise may not be enough to prevent further rate hikes.
China’s credit and monetary aggregates for August produced an unexpected combination of above-consensus total social financing (TSF) (CNY1,520B) and below-consensus new Chinese yuan loans (CNY1,280B). One possible explanation for the surprising TSF print is a smaller decline in shadow banking financing (see chart below). Another reason is stronger corporate bond issuance. Both factors reflect the recent policy fine-tuning, including easier monetary policy and relaxed regulations. The consensus expectation is that these changes will support China’s growth outlook in Q4 2018-Q1 2019, offsetting the negative impact of the trade dispute with the U.S., but without adding too much to the inflation pressures (the moderating M2 1 growth points in the same direction).
India’s monetary policy puzzle is looking a bit more complicated after the release of lower-than-expected inflation this morning. Headline inflation moderated to 3.69% year-on-year in August – a welcome move in the run up to the central bank’s policy meeting on October 5, 2018. At the same time, the core inflation dynamics remain concerning (elevated at 5.9% year-on-year in August), especially against a backdrop of ongoing rupee weakness and potentially the need for more currency adjustment in order to prevent the current account deficit from further widening. It is with these reasons in mind that the market continues to price in two full hikes in India in the next three months.
The market reaction to a sizable downside surprise in the U.S. producer prices was muted, but it added to uncertainty about the strength of underlying inflation pressures before tomorrow’s Consumer Price Index (CPI) release. This uncertainty helps to explain why the market continues to price in significantly less cumulative tightening in 2019 and 2020 than suggested by the U.S. Federal Reserve’s dot plot 2
Chart at a Glance
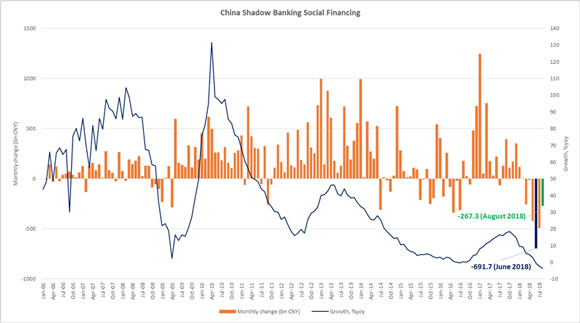
Source: VanEck; Bloomberg LP
1 M2 is a broad measure of money supply for the CNY, including all cash in circulation and money held in bank accounts.
2 The dot plot shows where each member of the Federal Open Market Committee thinks the fed funds rate should be at the end of the year for the next few years.
RSS Import: Original Source
