ElliottWave-Forecast has built its reputation on accurate technical analysis and a winning attitude. By successfully incorporating the Elliott Wave Theory with Market Correlation, Cycles, Proprietary Pivot System, we provide precise forecasts with up-to-date analysis for 50 instruments including FX majors, Gold, Silver, Copper, Oil, Natural Gas, Soybeans, Sugar ,Corn TNX and a number of Equity Indices from around the World. Our clients also have immediate access to our proprietary Actionable Trade Setups, Market Overview, 1 Hour, 4 Hour, Daily & Weekly Wave Counts. Weekend Webinar, Live Screen Sharing Sessions, Daily Technical Videos, Elliott Wave Setup videos, Educational Resources, and 24 Hour chat room where they are provided live updates and given answers to their questions. The guidance of ElliottWave-Forecast gives subscribers the wherewithal to position themselves for proper entry and exit in the Forex marketplace. We believe our disciplined methodology is pivotal for long-term success in trading.
Caterpillar Inc ( CAT): Trading Higher Within A Wave (III), Target Above $600.00
Caterpillar Inc., commonly known as CAT, is a leading American manufacturer of construction and mining equipment, diesel and natural gas engines, industrial gas turbines, and diesel-electric locomotives. Caterpillar operates globally and is known for its extensive product line, which includes machinery like bulldozers, excavators, wheel loaders, and haul trucks. Below we will look at the long term Elliott Wave outlook of the company.
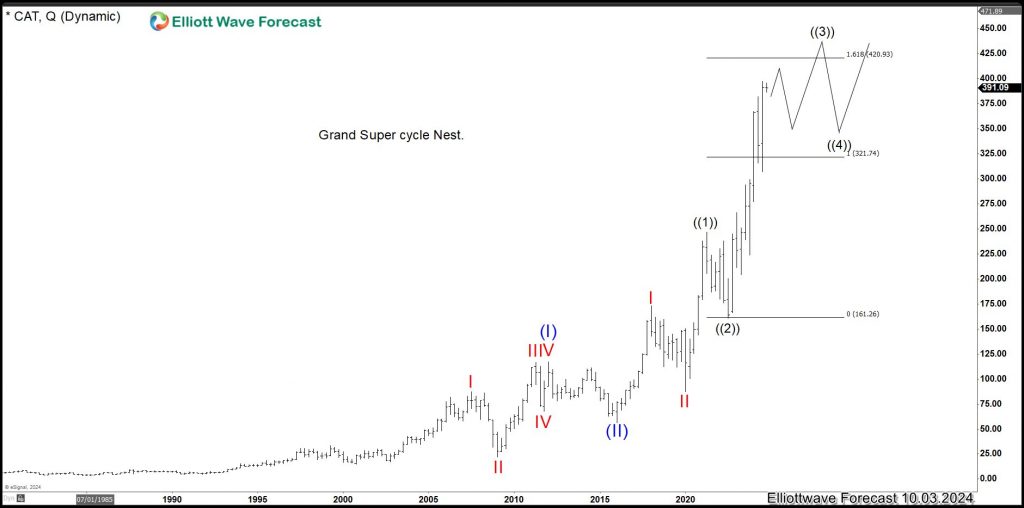
Caterpillar Quarterly Elliott Wave Chart
Quarterly Elliott Wave chart of Caterpillar above (CAT) shows that the stock extended higher strongly within wave (III). The subdivision of wave (III) is unfolding as a nesting 5 waves impulse. Up from wave (II), wave I ended at 173.24 and dips in wave II ended at 87.50. The stock nested higher in wave III with wave ((1)) ended at 246.69 and pullback in wave ((2)) ended at 160.60. Stock should continue to extend higher and dips to find support in 3, 7, 11 swing as the stock continues to extend higher in impulsive structure.
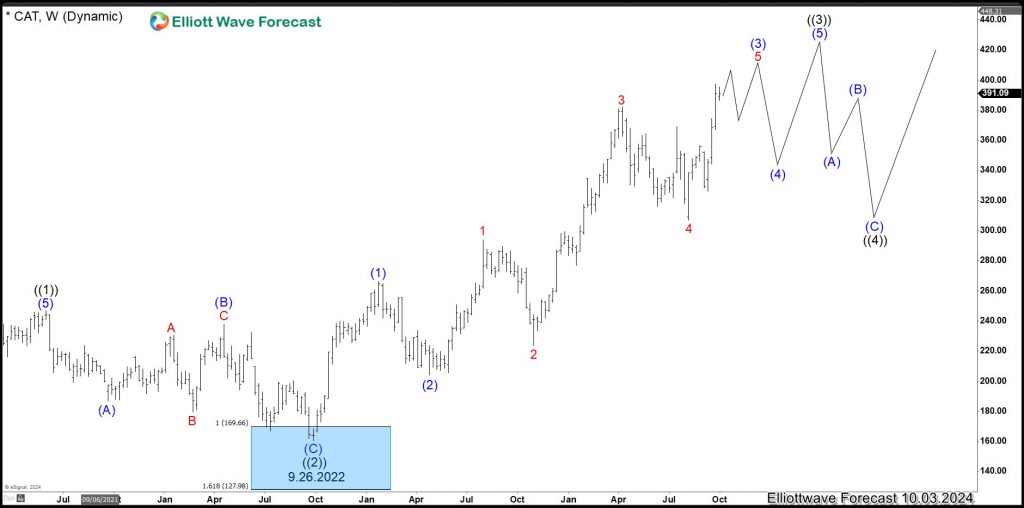
Weekly Caterpillar (CAT) Elliott Wave Chart
Weekly Elliott Wave Chart of Caterpillar (CAT) above shows that pullback to 160.6 ended wave ((2)) on September 26, 2022. Stock has resumed higher in wave ((3)) with internal subdivision as an impulse. Up from wave ((2)), wave (1) ended at 266.04 and pullback in wave (2) ended at 204.04. Stock rallied higher as a nesting impulse. Wave 1 ended at 293.88 and wave 2 dips ended at 223.76. Wave 3 higher ended at 382.01 and pullback in wave 4 ended at 307.05. Expect the stock to continue to extend higher in the impulsive structure.
Source: https://elliottwave-forecast.com/video-blog/caterpillar-inc-cat-trading-higher-within-a-wave-ii-target-above-600-00/


