Camber Energy Inc. ($CEI) Is The Bottom Set?
The last time I analyzed Camber Energy was back in September 2021. At the time I was looking for a peak to materialize and then pull back against the rally from the lows set in August 2021. The stock vastly outperformed where I was expecting it to peak, however, the pullback did materialize as anticipated. Firstly, lets review what the company profile:
Camber Energy, Inc. (“Camber”) is a growth-oriented, diversified energy company. Through its majority-owned subsidiary, Viking Energy Group, Inc. (“Viking”), or subsidiaries of Viking, Camber provides custom energy & power solutions to commercial and industrial clients in North America and owns interests in oil and natural gas assets in the United States. Viking also holds an exclusive license in Canada to a patented carbon-capture system.
Lets take a look at the chart from September 2021.
Elli0ttwave View September 2021:
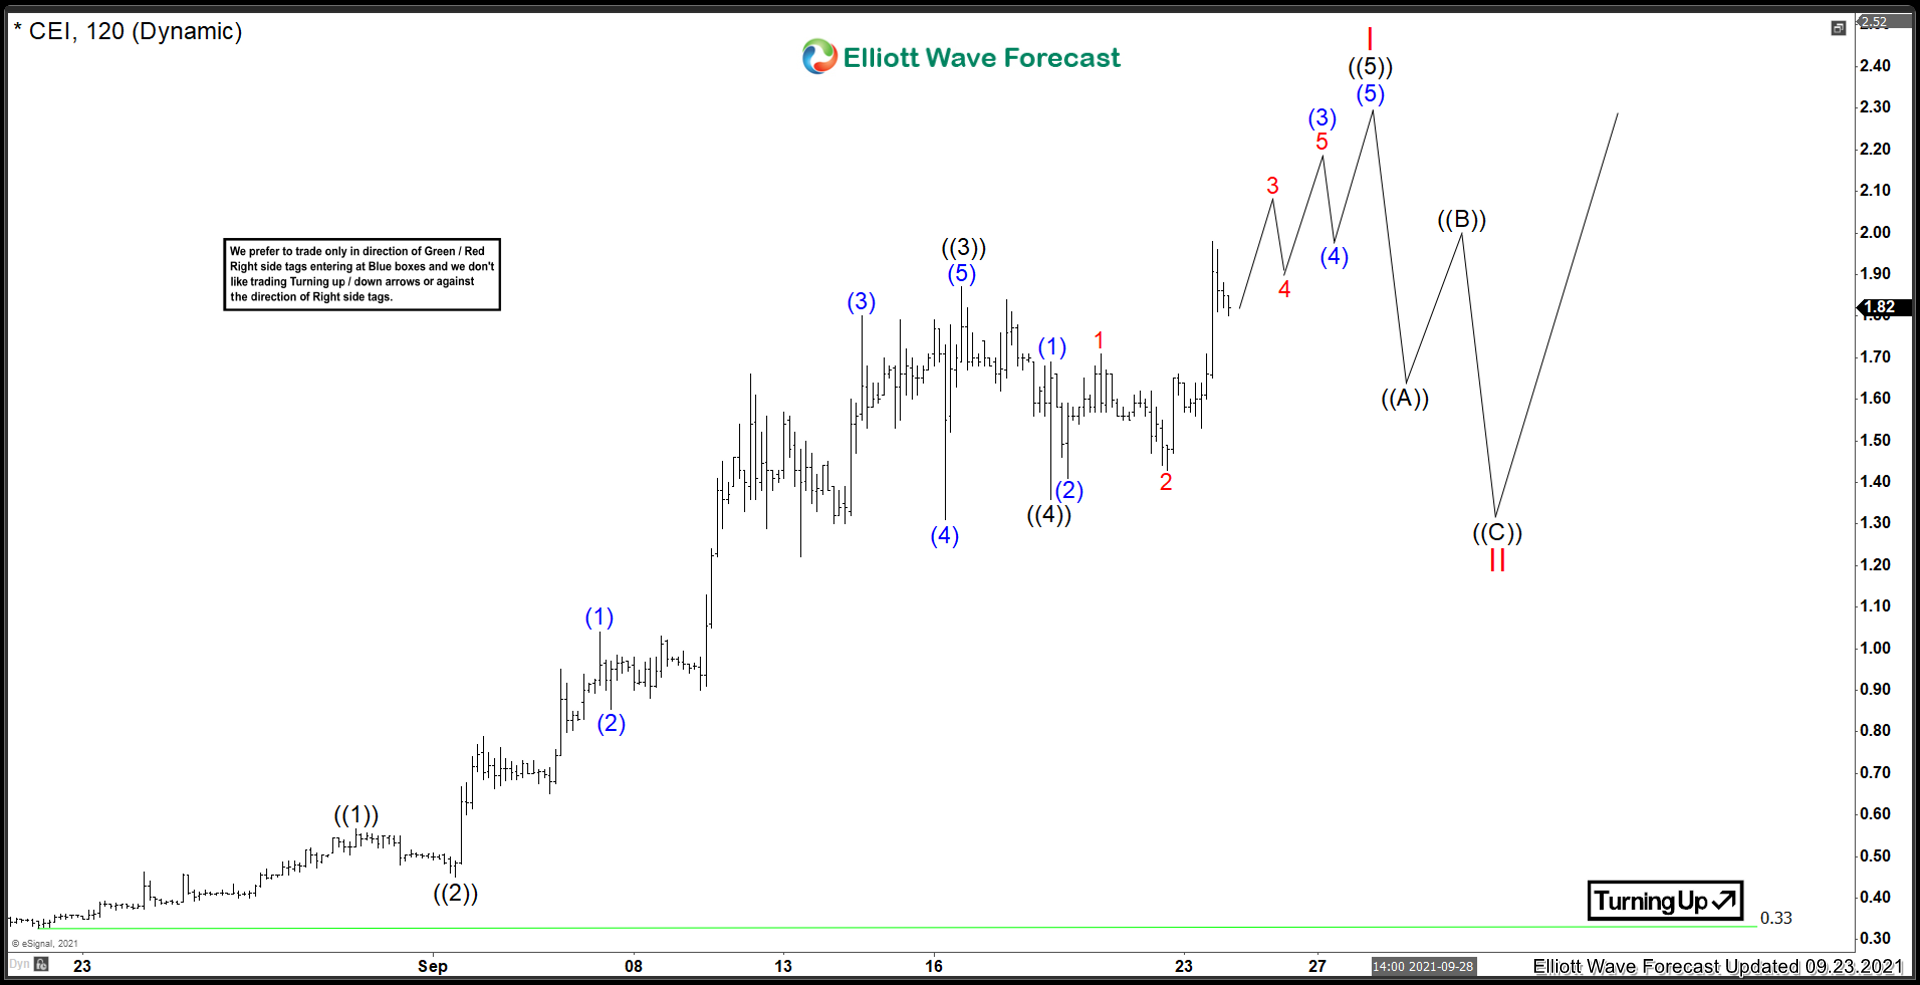
As mentioned above, I was expecting another push higher into Red I. Thereafter, I was expecting a pullback to take place. The rally unfolded in a very sharp advance and eventually peaked on September 29th 2021, 6 days after I published this chart, at a price of $4.85. After that, the correction that has taken place has been a long drawn out pullback. Lets take a look at the current view below:
Elli0ttwave View March 2022:
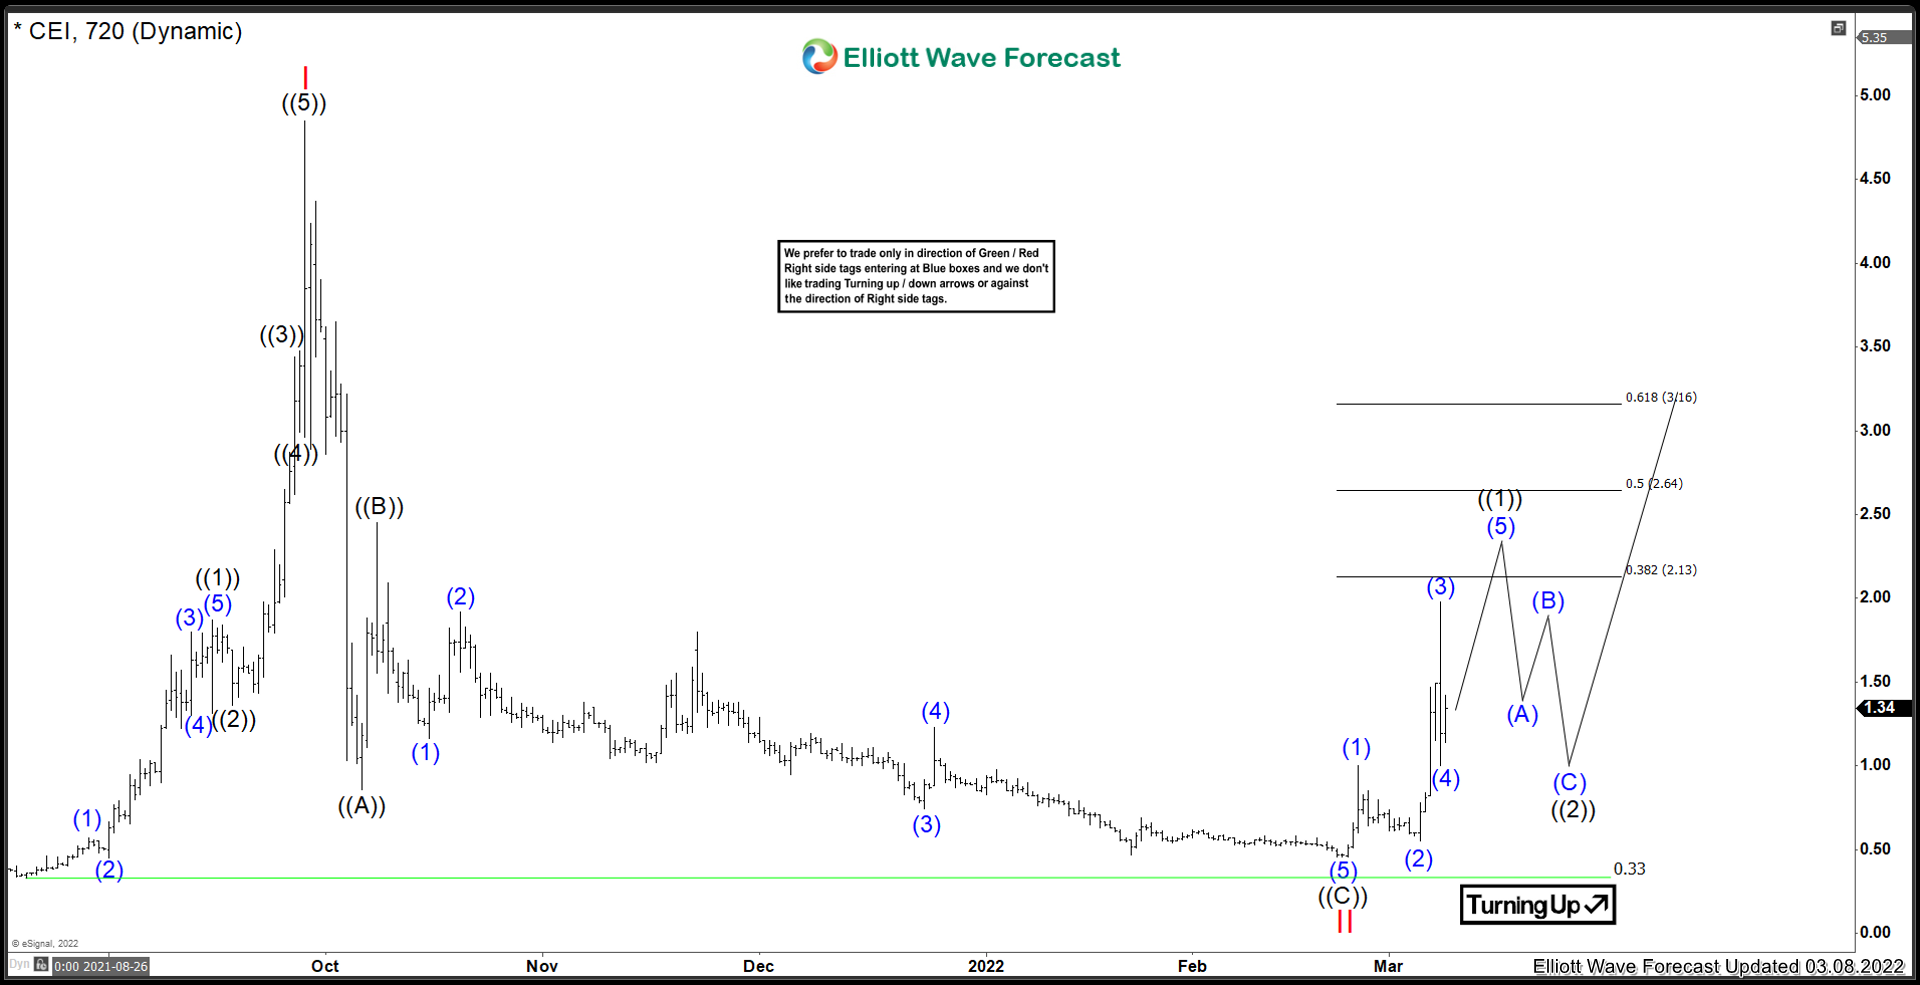
Medium term term view from the Feb 22/2022 low at 0.45. The stock currently has 3 waves up from the Feb 2022 low, and needs more more high to confirm the view of 5 waves up from the low. There are some Fibonacci retracement levels of note that we can look to for possible areas where ((1)) can peak. The 38.2% @ 2.13, the 50% @ 2.64, and the 61.8% @ 3.16. The prefered area where ((1)) can pull back is at the 61.8% level of 3.16. It is very important that the recent Feb 2022 lows remain intact. Any breach of that level could suggest that new all time lows could be on the way. On the upside, the target area for Red III is 4.98 to 7.78.
Source: https://elliottwave-forecast.com/stock-market/camber-energy-inc-cei-bottom-set/