
Building the right defense in equities
By Kate Moore , Yanni Angelakos
High-yielding “bond proxies” earned their stripes as equity safe havens as bond yields were slow to revert to pre-crisis levels. We look at what may constitute the new defense in equities as interest rates transition from “lower for longer” to higher at long last.
Equity highlights
- Traditional high-dividend stocks could do more harm than good in an environment of higher rates and inflation. They have underperformed broad indexes year-to-date and are vulnerable to rate moves. Minimum-volatility (min-vol) strategies suffered a similar fate, suggesting a good defense is a multi-faceted one.
- The “why” behind rate rises is important. Different sectors tend to play better defense depending on the impetus for rising rates. When yields are rising faster than inflation expectations, as they are today, cyclical (rather than defensive) rate-sensitive sectors can lead. U.S. banks, in particular, appear well positioned.
- Defense in stocks today is less about high yield and more about quality and the ability to outrun inflation, in our view. Companies with the free cash flow to boost dividends also tend to sport attractive valuations versus the highly bid high yielders.
Snapshot
High-yielding bond proxies did not offer downside protection in the February stock rout . It’s a role they historically have played well in drawdowns caused by economic deterioration and other risk-off periods. But this sell-off came amid a steady global expansion. The impetus this time, aside from a technical matter of investors exiting strategies betting on low volatility, was fears over rising rates and inflation.
Strong growth provides a solid foundation for stocks, we believe, but this experience makes it worth considering whether bond proxies can provide the same downside protection they have historically. They may even face competition from bonds for the first time in nearly 10 years.
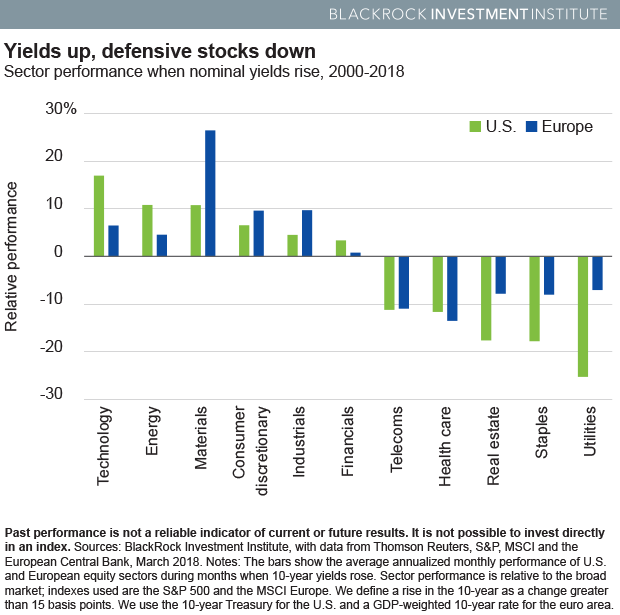
We analyzed S&P 500 sector performance from 2000 to present to isolate vulnerabilities. The findings: Traditional defensive sectors such as utilities, telecommunications, real estate and consumer staples provided minimal protection when nominal yields moved higher. Our analysis reveals this relationship has held outside the U.S. as well. See the Yields up, defensive stocks down chart.
Article originally on BlackRock.com
General disclosure: This material is prepared by BlackRock and is not intended to be relied upon as a forecast, research or investment advice, and is not a recommendation, offer or solicitation to buy or sell any securities or to adopt any investment strategy. The opinions expressed are as of March 2018 and may change as subsequent conditions vary. The information and opinions contained in this material are derived from proprietary and nonproprietary sources deemed by BlackRock to be reliable, are not necessarily all inclusive and are not guaranteed as to accuracy. As such, no warranty of accuracy or reliability is given and no responsibility arising in any other way for errors and omissions (including responsibility to any person by reason of negligence) is accepted by BlackRock, its officers, employees or agents. This material may contain ‘forward looking’ information that is not purely historical in nature. Such information may include, among other things, projections and forecasts. There is no guarantee that any forecasts made will come to pass. Reliance upon information in this material is at the sole discretion of the reader. Index data cited herein are from Thomson Reuters, unless otherwise noted.
In the U.S ., this material is for public distribution. In the EU, issued by BlackRock Investment Management (UK) Limited (authorised and regulated by the Financial Conduct Authority). Registered office: 12 Throgmorton Avenue, London, EC2N 2DL. Registered in England No. 2020394. Tel: 020 7743 3000. For your protection, telephone calls are usually recorded. BlackRock is a trading name of BlackRock Investment Management (UK) Limited. This material is for distribution to Professional Clients (as defined by the FCA Rules) and Qualified Investors and should not be relied upon by any other persons. For qualified investors in Switzerland , this material shall be exclusively made available to, and directed at, qualified investors as defined in the Swiss Collective Investment Schemes Act of 23 June 2006, as amended. Issued in the Netherlands by the Amsterdam branch office of BlackRock Investment Management (UK) Limited: Amstelplein 1, 1096 HA Amsterdam, Tel: 020 - 549 5200. In South Africa , please be advised that BlackRock Investment Management (UK) Limited is an authorized Financial Services provider with the South African Financial Services Board, FSP No. 43288. In Dubai : This information can be distributed in and from the Dubai International Financial Centre (DIFC) by BlackRock Advisors (UK) Limited ‒ Dubai Branch which is regulated by the Dubai Financial Services Authority (“DFSA”) and is only directed at 'Professional Clients’ and no other person should rely upon the information contained within it. Neither the DFSA or any other authority or regulator located in the GCC or MENA region has approved this information. This information and associated materials have been provided for your exclusive use. This document is not intended for distribution to, or use by, any person or entity in any jurisdiction or country where such distribution would be unlawful under the securities laws of such. Any distribution, by whatever means, of this document and related material to persons other than those referred to above is strictly prohibited. For investors in Israel : BlackRock Investment Management (UK) Limited is not licensed under Israel's Regulation of Investment Advice, Investment Marketing and Portfolio Management Law, 5755-1995 (the “Advice Law”), nor does it carry insurance thereunder. In Singapore , this is issued by BlackRock (Singapore) Limited (Co. registration no. 200010143N). In Hong Kong , this material is issued by BlackRock Asset Management North Asia Limited and has not been reviewed by the Securities and Futures Commission of Hong Kong. In Korea , this material is for Professional Investors only. In Taiwan , independently operated by BlackRock Investment Management (Taiwan) Limited. Address: 28/F, No. 95, Tun Hwa South Road, Section 2, Taipei 106, Taiwan. Tel: (02)23261600. In Japan , this is issued by BlackRock Japan. Co., Ltd. (Financial Instruments Business Operator: The Kanto Regional Financial Bureau. License No375, Association Memberships: Japan Investment Advisers Association, the Investment Trusts Association, Japan, Japan Securities Dealers Association, Type II Financial Instruments Firms Association.) For Professional Investors only (Professional Investor is defined in Financial Instruments and Exchange Act) and for information or educational purposes only, and does not constitute investment advice or an offer or solicitation to purchase or sells in any securities or any investment strategies. In Australia , issued by BlackRock Investment Management (Australia) Limited ABN 13 006 165 975, AFSL 230 523 (BIMAL). This material is not a securities recommendation or an offer or solicitation with respect to the purchase or sale of any securities in any jurisdiction. The material provides general information only and does not take into account your individual objectives, financial situation, needs or circumstances. BIMAL, its officers, employees and agents believe that the information in this material and the sources on which it is based (which may be sourced from third parties) are correct as at the date of publication. While every care has been taken in the preparation of this material, no warranty of accuracy or reliability is given and no responsibility for the information is accepted by BIMAL, its officers, employees or agents. No guarantee as to the repayment of capital or the performance of any product or rate of return referred to in this material is made by BIMAL or any entity in the BlackRock group of companies. In China , this material may not be distributed to individuals resident in the People's Republic of China (“PRC,” for such purposes, excluding Hong Kong, Macau and Taiwan) or entities registered in the PRC unless such parties have received all the required PRC government approvals to participate in any investment or receive any investment advisory or investment management services. For other APAC countries , this material is issued for Institutional Investors only (or professional/sophisticated/qualified investors, as such term may apply in local jurisdictions) and does not constitute investment advice or an offer or solicitation to purchase or sell in any securities, BlackRock funds or any investment strategy nor shall any securities be offered or sold to any person in any jurisdiction in which an offer, solicitation, purchase or sale would be unlawful under the securities laws of such jurisdiction. In Canada , this material is intended for permitted clients only. In Latin America and Iberia , this material is for educational purposes only and does not constitute investment advice nor an offer or solicitation to sell or a solicitation of an offer to buy any shares of any fund (nor shall any such shares be offered or sold to any person) in any jurisdiction in which an offer, solicitation, purchase or sale would be unlawful under the securities law of that jurisdiction. If any funds are mentioned or inferred to in this material, it is possible that some or all of the funds have not been registered with the securities regulators of Argentina, Brazil, Chile, Colombia, Mexico, Panama, Peru, Portugal, Spain, Uruguay or any other securities regulator in any Latin American country and thus might not be publicly offered within any such country. The securities regulators of such countries have not confirmed the accuracy of any information contained herein. The information provided here is neither tax nor legal advice. Investors should speak to their tax professional for specific information regarding their tax situation. Investment involves risk including possible loss of principal. International investing involves risks, including risks related to foreign currency, limited liquidity, less government regulation, and the possibility of substantial volatility due to adverse political, economic or other developments. These risks are often heightened for investments in emerging/developing markets or smaller capital markets.
©2018 BlackRock, Inc. All Rights Reserved. BLACKROCK is a registered trademark of BlackRock, Inc. All other trademarks are those of their respective owners.
BII0218U/E-433241-1370344
