ElliottWave-Forecast has built its reputation on accurate technical analysis and a winning attitude. By successfully incorporating the Elliott Wave Theory with Market Correlation, Cycles, Proprietary Pivot System, we provide precise forecasts with up-to-date analysis for 50 instruments including FX majors, Gold, Silver, Copper, Oil, Natural Gas, Soybeans, Sugar ,Corn TNX and a number of Equity Indices from around the World. Our clients also have immediate access to our proprietary Actionable Trade Setups, Market Overview, 1 Hour, 4 Hour, Daily & Weekly Wave Counts. Weekend Webinar, Live Screen Sharing Sessions, Daily Technical Videos, Elliott Wave Setup videos, Educational Resources, and 24 Hour chat room where they are provided live updates and given answers to their questions. The guidance of ElliottWave-Forecast gives subscribers the wherewithal to position themselves for proper entry and exit in the Forex marketplace. We believe our disciplined methodology is pivotal for long-term success in trading.
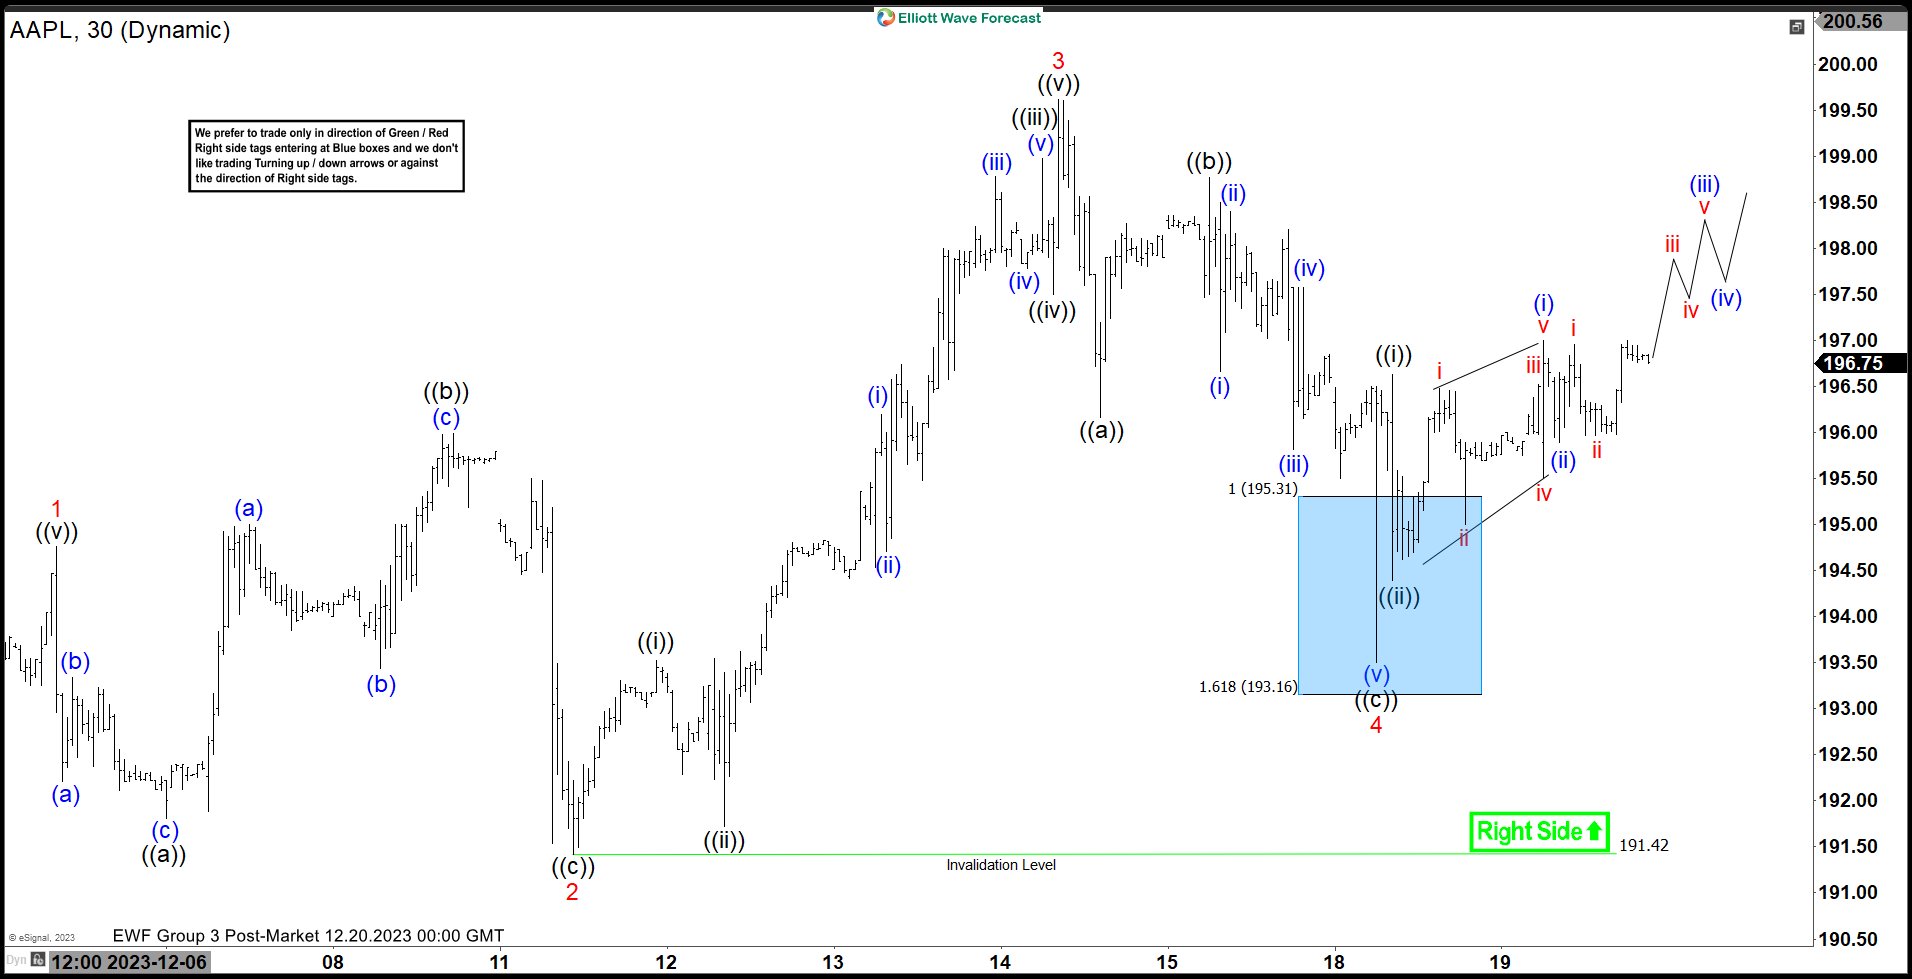
Apple Inc. ($AAPL) Found Buyers at the Blue Box Area as Expected.
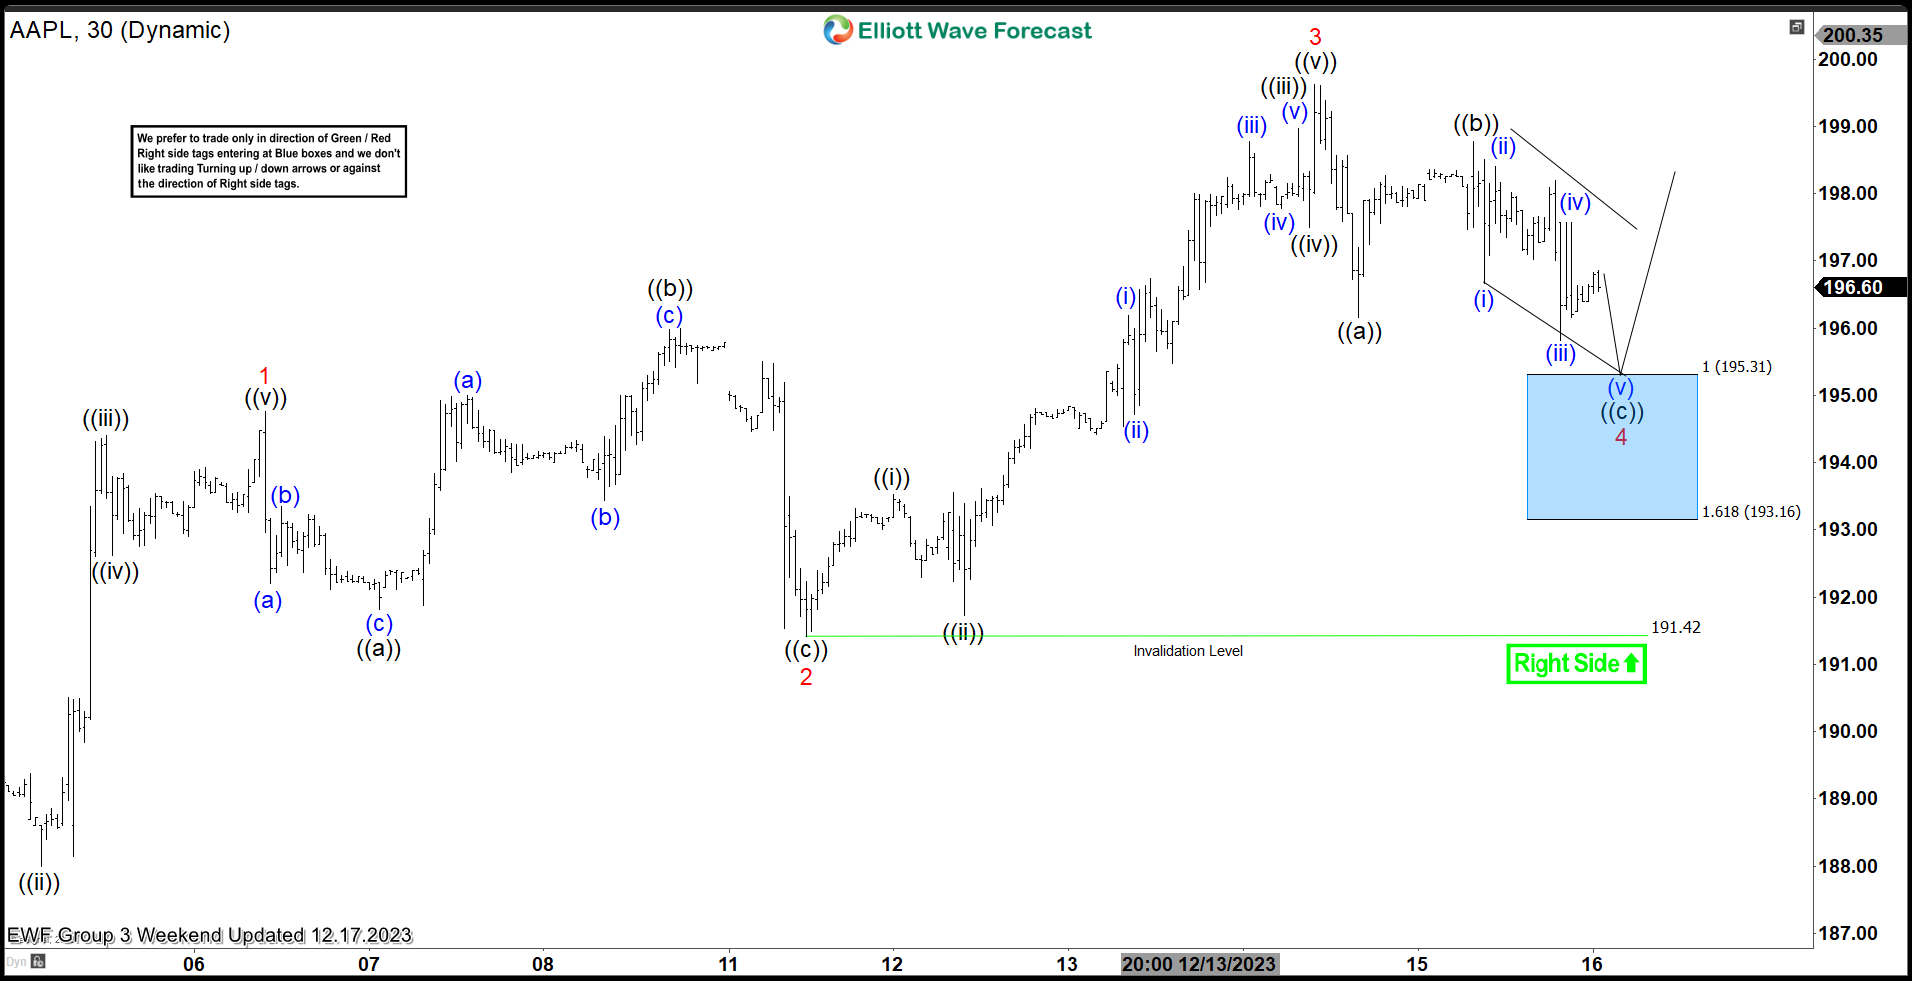
Hello everyone. In today’s article, we will look at the past performance of the 1H Hour Elliott Wave chart of Apple Inc ($AAPL). The rally from 12.11.2023 low at $191.42 unfolded as 5 waves. So, we expected the pullback to unfold in 3 swings and find buyers at 195.31 - 193.16. We will explain the structure & forecast below:
$AAPL 1H Elliott Wave Chart 12.17.2023:
Here is the 1H Elliott Wave count from 12.17.2023. We expected the pullback to find buyers from the blue box area at red 4 in a 3 swing structure (ABC) at 195.31 - 193.16.
$AAPL 1H Elliott Wave Chart 12.20.2023:
Here is the 1H update few days later, showing the bounce taking place as expected. The stock reacted higher after reaching the blue box area allowing longs to get a risk free position.
Source: https://elliottwave-forecast.com/stock-market/apple-aapl-found-buyers-blue-box-area/