Alibaba : Elliott Wave Running Flat Taking Place
We believe Alibaba will see more downside based on a sequence which started on 6.5.2018 high. It is showing an extra swing at 12.24.2018. This low can be counted as swing number 9 in Blue or beginning of the swing 1 Black of 3 red. The chart below shows the extra swing.
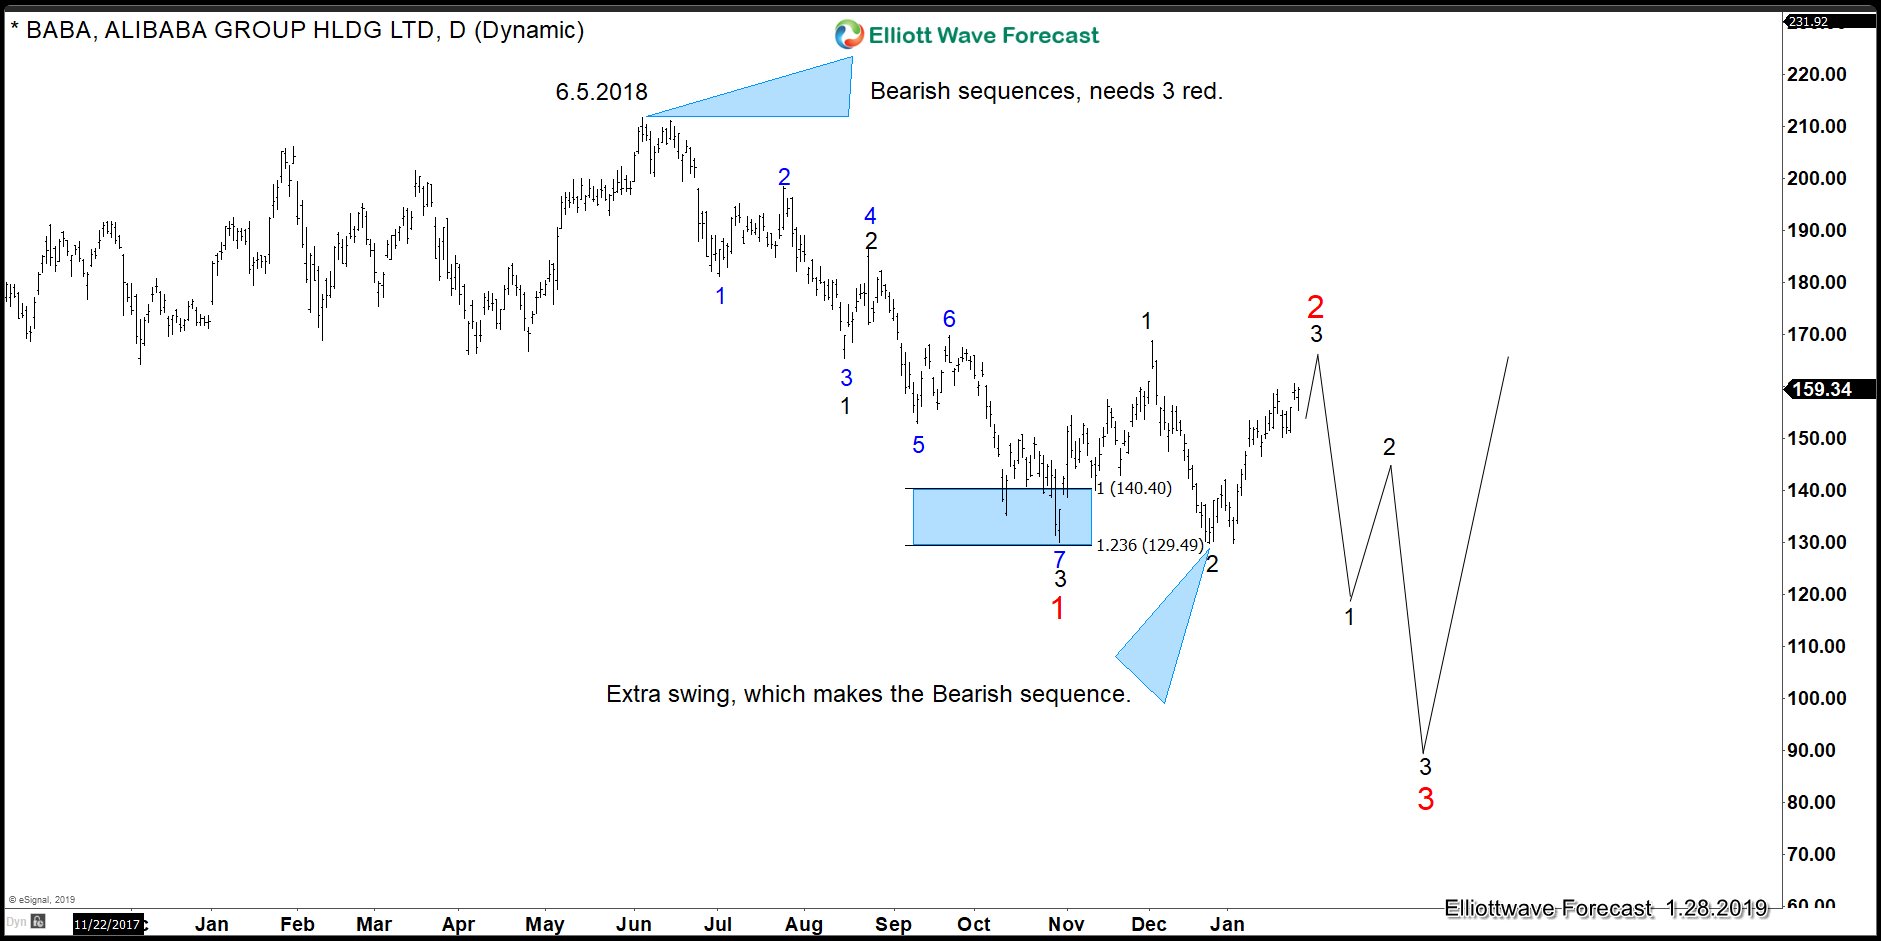
Alibaba should remain under pressure and see more downside when the cycle or structure which started at 10.30.2018 low ends. At Elliottwave-Forecast, we pay attention to the sequence and correlation across the market. We use Elliott wave to spot the structure and then take a side and forecast the higher probability outcome. We believe the Stock is doing an Elliott wave Running Flat since the low at 10.30.2018. The Flat is very clear due to the strength and nature of the reaction in 5 waves from the low at 12.24.2018. We can count the move higher a 5 waves impulse advance.
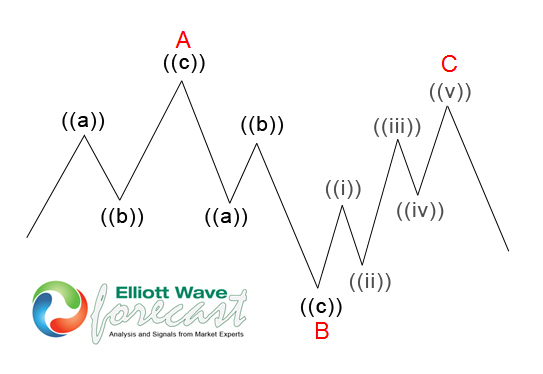
Running Flat is a structure with the following guidelines:
• A corrective 3 wave move labelled as ABC
• Subdivision of wave A and B is in 3 waves
• Internal of wave C is in 5 waves impulse / diagonal
• Subdivision of wave A and B can be in any corrective 3 waves structure including zigzag, flat, double three, triple three
• Wave B of the 3-3-5 pattern terminates beyond the starting level of wave A as in an expanded flat
• Wave C fails travel the full distance, falling short of the level where wave A ended
• Momentum divergence should appear in wave C
The running Flat should follow this Fibonacci ratio relationship
• Wave B = 123.6% of wave A
• Wave C = 61.8% – 100% of wave AB
The following chart reflects how a running flat looks like in the Elliott Wave theory.
BABA 4 Hour Elliott Wave Analysis
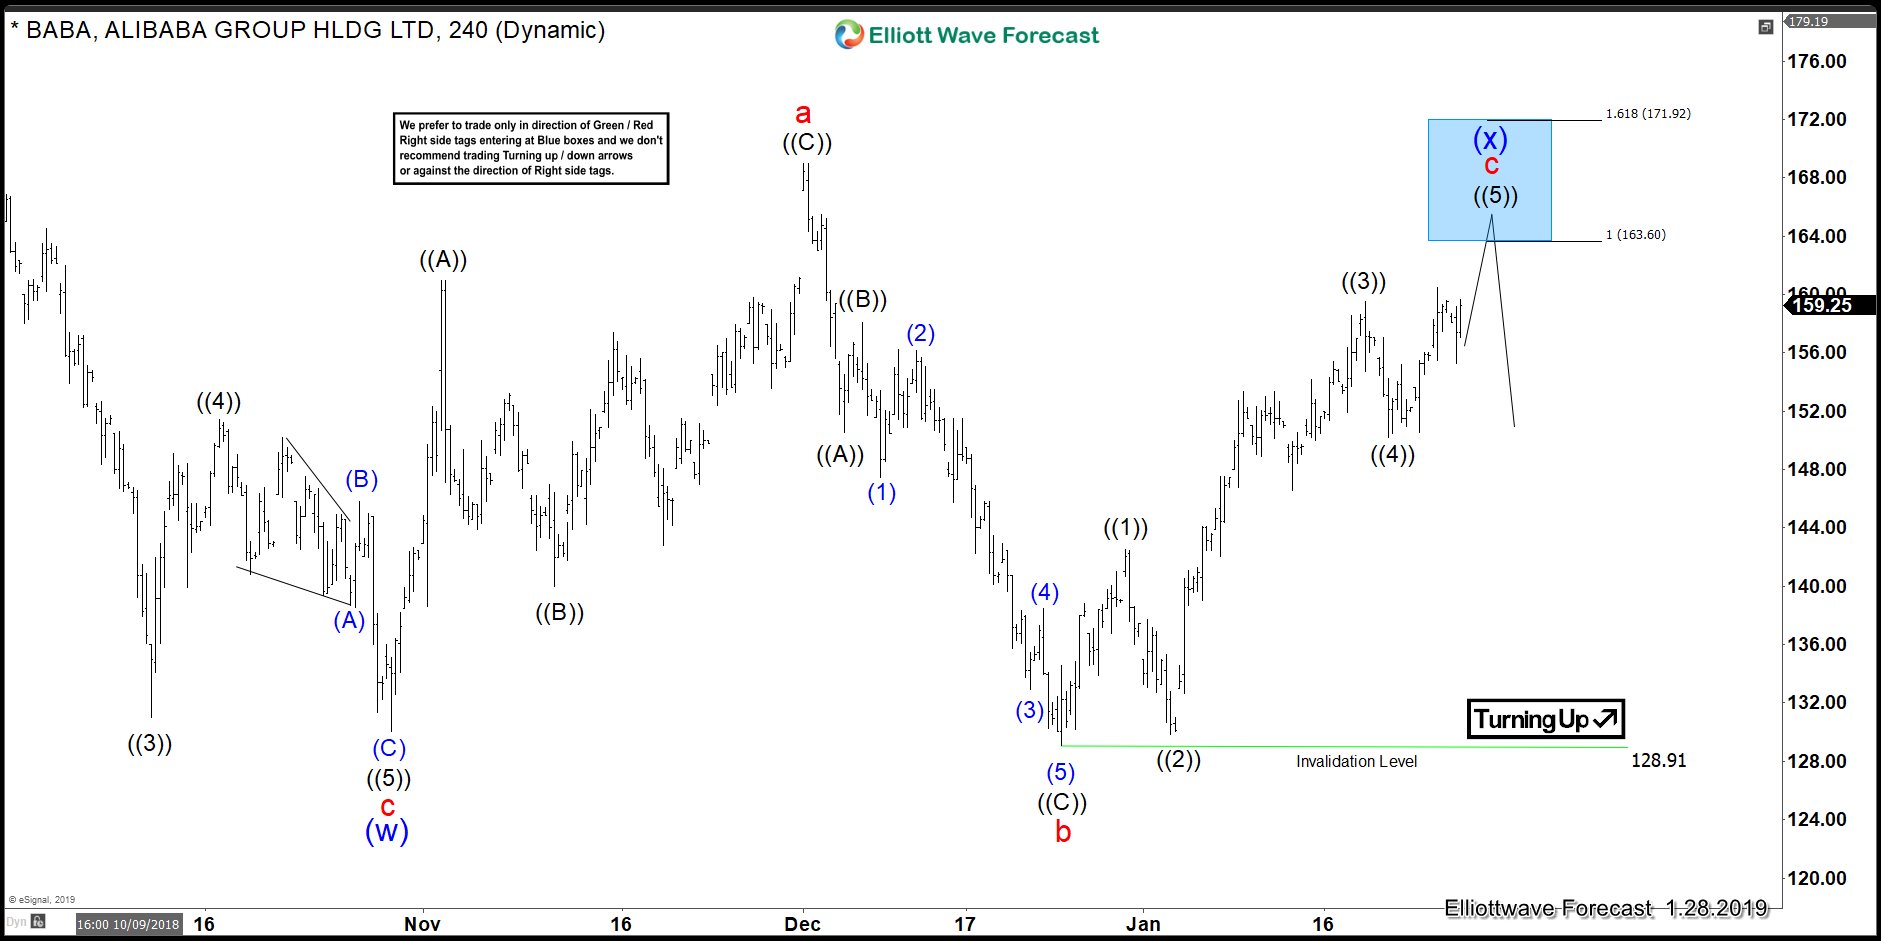
The chart above is showing a clear Elliott wave structure. In finding a structure that fits the price action since the lows at 10.30.2018 and at the same time relates well with ther instrument, we can conclude that a running flat is the most aggressive view.