
A Flat Muni Yield Curve
April 23, 2019
The assumptions behind the curve - A FLAT MUNI YIELD CURVE?
Municipal bond investors can be fickle, leading to weakness in munis, but we believe today's muni markets have priced in a large surprise in the macro backdrop, which is not our base case.
Much has been said lately about the flatness of the yield curve. Municipal bonds, with their own peculiar yield curve, have also exhibited remarkable flatness in recent months. Although previous periods of flat municipal bond yield curves have ended in difficult economic conditions, there are some important differences between the previous episodes and the conditions prevailing today. An outlook of moderate economic conditions is consistent with today’s data.
Here we examine historical data that presents the difference in yield between the 2-year and 10-year AAA benchmark municipal rates, the fed funds target upper-bound rate and the smoothed CPI. We include the smoothed CPI as a proxy for inflation and because of its relevance to the Fed policy rate.
Exhibit 1: Municipal Curve Slope in Relation to Inflation and Fed Policy
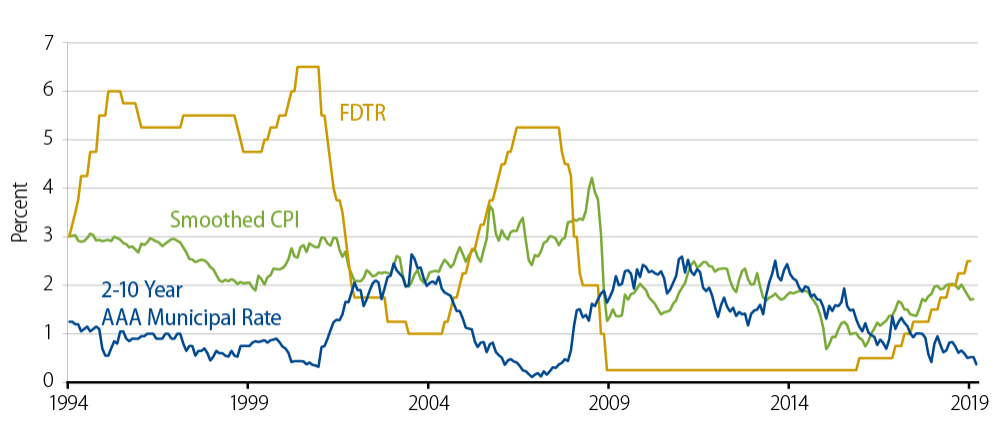
Sources: Thomson Reuters, Bloomberg, Bureau of Labor Statistics, Western Asset. As of 31 Mar 2019. Past performance is no guarantee of future results. This information is provided for illustrative purposes only and does not reflect the performance of an actual investment.
The 2-10 year curve slope has seldom been as flat as it is today. The flat period in the year 2000 was accompanied by rising inflation and a rising Fed policy rate. The curve steepened when the Fed responded to the technology stock crash by aggressively cutting the target rate. A similar dynamic occurred over 2004-2007 when a rising policy rate coincided with a flattening curve which persisted until instability in the markets prompted the Fed to cut rates aggressively. The economy then headed into a crisis emanating from the credit markets.
Today, we see some similarities and some differences from the two historical examples. Arguably, we can date the flattening trend back to 2013. After four years of abnormally low rates, policymakers were signaling an intention to return to normal rate levels. The first actual hike came in 2015 and, in fits and starts, the curve continued to flatten as both inflation and the policy rate edged up.
From today’s flat municipal curve slope, one might be tempted to think that steepness will soon return and that a repetition of historical economic conditions might occur. However, with the Fed currently on hold, the policy rate remains at a moderate level compared to the highs and lows reached in previous cycles. Moreover, the Fed’s policy rate is only slightly above the inflation rate. In our opinion, if anything in this data seems amiss, it is that the flat municipal curve is mispricing potential interest rate volatility by denying the 10-year investor a cushion of yield to compensate for higher sensitivity to rate changes. In sum, these observations are consistent with an outlook of moderate growth, benign inflation and muted actions from the Fed.
Muni investors can be fickle, and they don’t always wait for data to turn from optimistic to pessimistic. Unpredictable behavior could lead to municipal bond weakness, but we believe that environment would require a large surprise in the macro backdrop, which is not our base case.
Author: Robert Amodeo, CFA, Head of Municipals
Definitions:
The yield curve shows the relationship between yields and maturity dates for a similar class of bonds.
Inverted yield curve refers to a market condition when yields for longer-maturity bonds have yields which are lower than shorter-maturity issues.
The federal funds rate (fed funds rate, fed funds target rate or intended federal funds rate) is a target interest rate that is set by the FOMC for implementing U.S. monetary policies. It is the interest rate that banks with excess reserves at a U.S. Federal Reserve district bank charge other banks that need overnight loans.
The Consumer Price Index (CPI) measures the average change in U.S. consumer prices over time in a fixed market basket of goods and services determined by the U.S. Bureau of Labor Statistics.