
2018 HIGH YIELD BONDS IN A RISING RATE ENVIRONMENT
This paper updates an earlier version published in September 2014. We have extended our data set and added analysis of returns by rating bands. Our conclusions remain the same.
This paper examines the impact rising rates are likely to have on high yield bond performance. We conclude that while a rising rate environment would detract from high yield returns, historically returns have remained positive even as Treasuries and investment grade corporate bonds have generated losses. High yield bonds would continue to offer the benefits of relatively large current income and low correlations with other assets, thereby dampening overall portfolio volatility. We view high yield bonds as all-season investments for plan sponsors seeking to optimize the risk and return attributes of their portfolios.
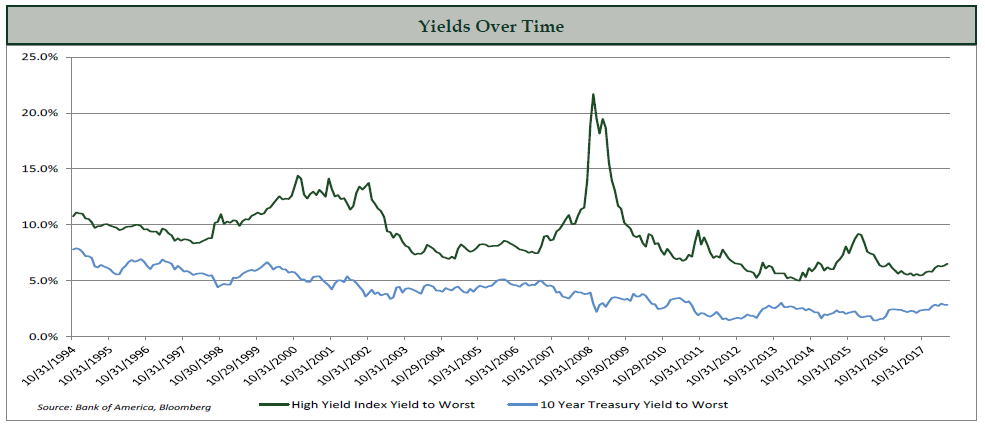
The general level of interest rates in the United States has been declining for most of the last 37 years, since the 10-year Treasury yield peaked at 15.8% in September 1981. The economy has benefited in many ways as rates have fallen, not the least because of the tailwind declining yields have provided for long term investors. Like any extended trend, this was not a straight ine decline; there were several notable reversals along the way. The 10-year rate reached a low of 1.36% in June 2016 before rebounding to 3.11% in May 2018. It has since drifted back to 2.87%, but many observers expect it to resume its rise as the Fed continues to hike short term rates to counter emerging inflationary forces.
It is impossible to know the future, but from current low levels we see more room for rates to rise than for them to fall.
High yield bond investors have been among the largest beneficiaries of this long-term decline in the general level of interest rates. As rates have fallen, high yield bond yields have declined and their prices have risen such that long-term investors in this asset class have enjoyed total returns exceeding the bonds’ coupons, despite default losses. Most observers expect returns to diminish considerably if Treasury rates rise by a meaningful amount. Many fear that returns will turn negative.
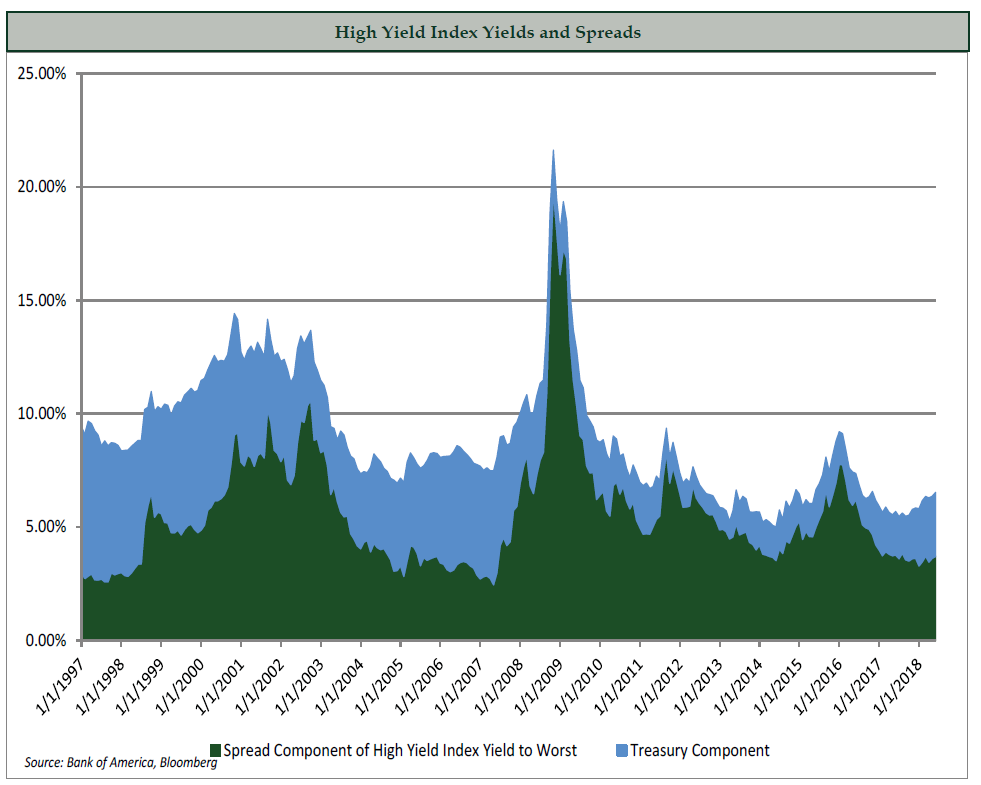
The following chart contains the same high yield history, and also contains the option-adjusted spread. The price of a high yield bond, expressed as its yield, is a combination of the yield on the same-duration Treasury bond (the blue shaded area) plus a ‘spread’ (the green shaded area). The spread reflects the creditworthiness of the issuer and issue specific characteristics such as its liquidity, redeemability, and seniority within the capital structure, as well as macro factors including economic expectations. Historically, the spread has averaged about 310 basis points above the default loss rate. The chart demonstrates the importance of the spread component within the overall yield of the bonds, especially during the current period of low rates, and its volatility as economic conditions change. When viewed from this perspective, it becomes clear that in periods of low rates, the spread is the most important component of the bonds’ yield, and as rates rise, the Treasury component becomes more significant.
Theoretically, high yield bond spreads move in opposite directions to Treasury yields, providing a natural damping effect. High yield spreads contract as default risk diminishes during economic expansions, when Treasury rates are rising, and spreads widen during recessions to reflect increasing default risk, as Treasury rates decline. The relatively large coupon income contributes to this dampening effect. This theory has held up during the past 20 years, as shown in the chart below.
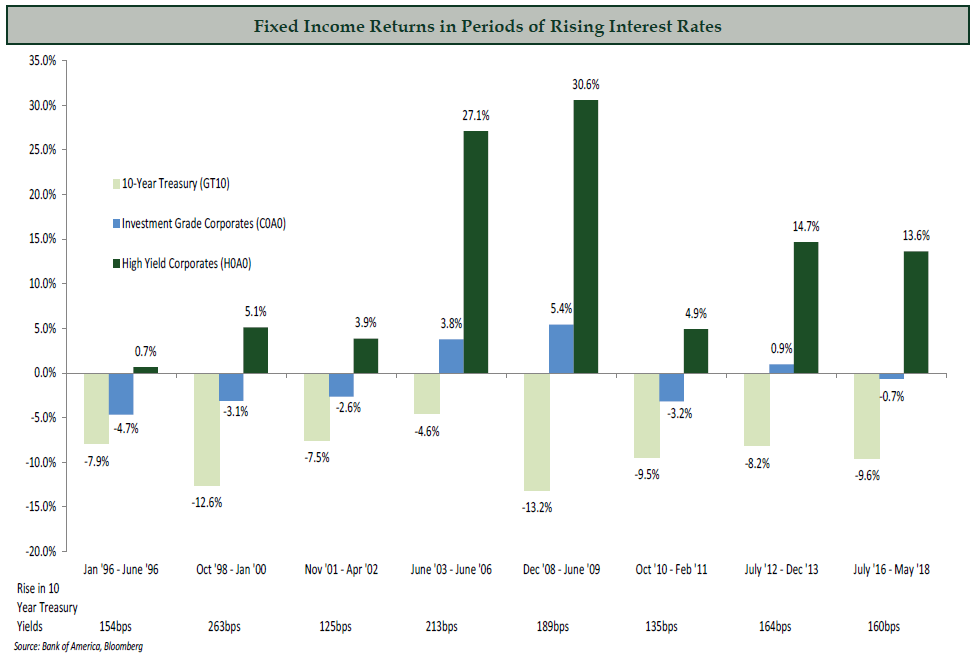
Advent’s research team reviewed all of the periods when rates rose by 100 basis points or more during the past 20 years. High yield investors had positive returns in each of those periods, in every case outperforming Treasuries and high grade corporates. As predicted, large coupons and spread contraction more than offset the impact of the rising Treasury rates.
The first episode, which occurred over only five months in 1996, was a characterized by a growing economy and soaring stock market. Those are typical conditions for rising interest rates driven by strong demand for capital. Despite the short time frame, high yield bonds managed to produce a small positive return, outperforming high grade corporates by 5.4% and the 10-year Treasury by 8.7%. It helped that the average coupon at that time was about 10%.
The largest rise in rates during the 20 year period occurred during the fifteen months from October 1998 to January 2000. This was the height of the late ‘90s bull market, with a very strong economy, very low unemployment, hints of inflation, and a powerful stock market rally. The dot-com boom was underway, including the build out of vast new communications and technological infrastructures, and capital was scarce. It is no surprise that rates rose dramatically during the period. Helped by the longer time frame, high yield bonds produced a 5.1% positive return while high grade corporates and the Treasury lost 3.1% and 12.6%, respectively.
Rates rose again during the 5 month period between November 2001 and April 2002. The dot-com bust recession had just ended and GDP grew by 1.7% in Q4 2001 and a whopping 6.1% in Q1 2002. Equity markets were weak and Enron filed for bankruptcy. The rate on the 10-year Treasury increased by 125 basis points, leading to a 7.6% loss for Treasury investors and a 2.7% loss for investment grade corporates. Despite the short timeframe, high yield investors earned 3.9%.
The longest interval of rising rates during this period occurred from June 2003 to June 2006, when the 10-year Treasury rate rose by 213 basis points. This was a time of broad economic expansion, strong capital markets, and good stock performance. The Fed gradually increased the federal funds rate from 1% to 5% as it sought to forestall inflationary pressures. With three years of coupons, high yield easily outperformed the 10-year Treasury, which lost 4.6%. High grade corporates had a positive return too, but well behind high yield’s 27.1%.
The seven months between December 2008 and June 2009 were among the most prosperous ever for high yield investors, with a total return of 30.6% despite the 189 basis point rise in the rate on the 10-year Treasury, which lost 13.2% during the period. This was the early part of the recovery from the financial crisis of 2008, when high yield led the markets out of the abyss. The economy was still struggling and liquidity had not yet been fully restored, but high yield investors concluded that the worst of the crisis was behind and that high yield bonds were deeply oversold and very attractive. This was a very good example of outperformance based on spread compression.
The shortest period of rising rates was between October 2010 and February 2011, when the Treasury rate increased by 135 basis points. The economy demonstrated accelerating growth and the stock market rallied. High yield returned 4.9% for the four months as spreads continued to compress. Investment grade corporates and the 10-year Treasury lost 3.2% and 9.5%, respectively.
Rates increased between July 2012 and December 2013, driven by the market’s fear that rates would move higher with the anticipated wind-down of the Fed’s QE programs. The second part of this increase has been labeled the ‘taper tantrum.’ The 10 year Treasury lost 8.2% during the 17 months, easily eclipsed by high yield’s 14.7% return which reflected both spread compression and the accrual of the relatively large coupon for nearly a year and a half.
The most recent period of increasing rates began in July 2016 and reached its peak – which may prove to be an interim peak – in May 2018. The Treasury rate increased by 175 basis points, from 1.36% to 3.11%. Much of this rise came after the election, as investors correctly anticipated favorable economic impacts from Trump’s plans to deregulate American industry and to reduce corporate and personal taxes. Those policies proved effective as GDP growth has accelerated and the economy has reached its full employment level. The economy is experiencing late-cycle conditions, including strong demand for capital and emerging inflation, which are putting upward pressure on rates. We expect these conditions to endure. The 10 year Treasury lost 9.6% during the 22 months, and investment grade corporates lost 0.7%. The High Yield Index returned 13.6% as spreads compressed by 252 basis points, more than offsetting the increase in the Treasury rate.
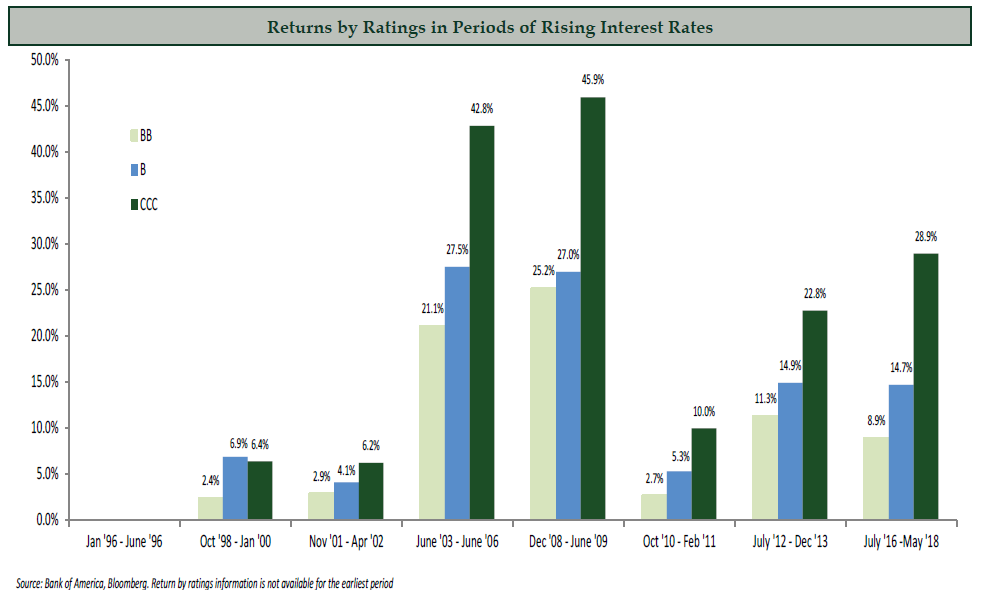
We also examined the performance of high yield bonds by ratings during periods of rising rates. Those results are displayed in the table below. The lowest rated bonds (CCC and below) were the best performers in each of the periods, and the best-rated (BB) were the worst. Our pricing model predicts this. Higher rated bonds have a larger Treasury component of their overall valuation, and thus are more sensitive to Treasury rates. Lower rated bonds have a larger spread component, which generally benefits from economic expansions associated with rising rates. That spread compression usually offsets some or all of the increase in rates.
To complete our analysis, we reviewed high yield performance as the Treasury yield curve shifted during the last 30 years. We were unable to come to any strong conclusions due to the limited data set; however we can make certain observations. We found that high yield generally performed poorly in the one-year period following maximum curve inversion. Each of these periods preceded a recession and was characterized by falling rates and steepening curves. The poor performance likely reflected the imminent recession rather than the shape of the yield curve. Conversely, in periods of significant flattening, we found that high yield performs well, with positive returns that outperformed investment grade bonds in almost every case. Those periods were characterized by strong economic growth which we believe was the driver of the strong high yield bond performance.
Undoubtedly, as investors think about rising rates their first concern is the effect on returns. But for sophisticated investors focused on large, diverse investment portfolios, volatility and correlations with other assets are equally important. We computed these metrics for several asset classes over the last 31 years, and also for most of the past eleven years, when rates have been low. The results are displayed in the tables below:
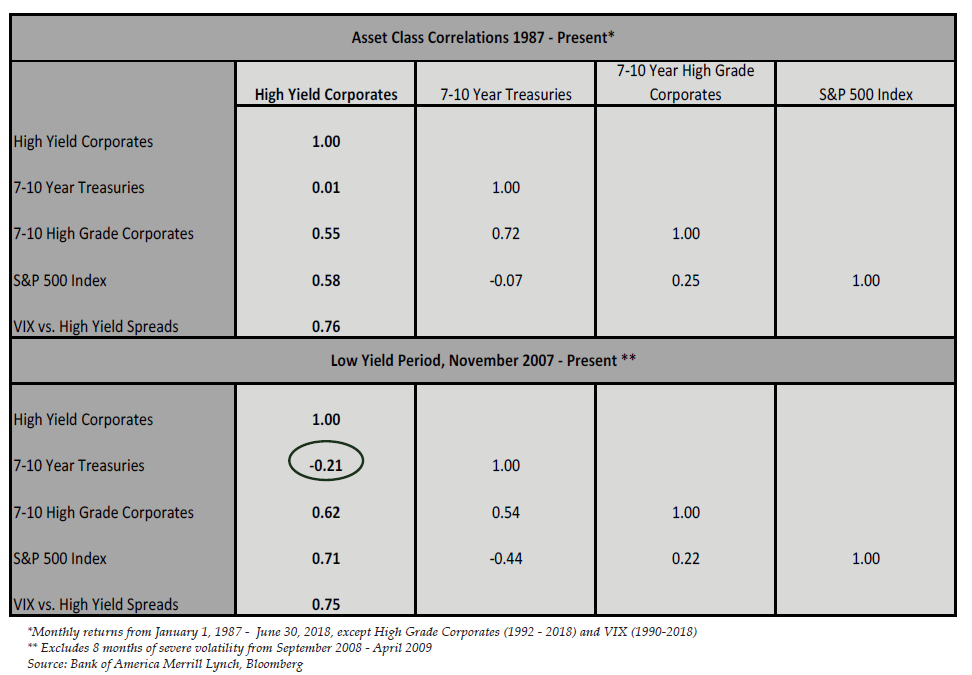
When viewed through the context of our high yield pricing model, one would expect the correlation with Treasuries to increase as rates rise, simply because the Treasury component of the bond’s yield expands. Similarly, because the spread component contracts, correlations with equities should decline. This is borne out by the numbers. High yield returns are uncorrelated with the 10-year Treasury in the normal environment, but have a negative correlation in the low yield period. That negative correlation makes high yield a very powerful addition to a core fixed income portfolio. By incorporating high yield, an investor can both improve returns and reduce volatility. The imperfect correlation with equities creates a similar but less compelling opportunity to improve an equity portfolio’s return characteristics, except in this case the effect is weaker in the low rate environment, because the correlation is higher.
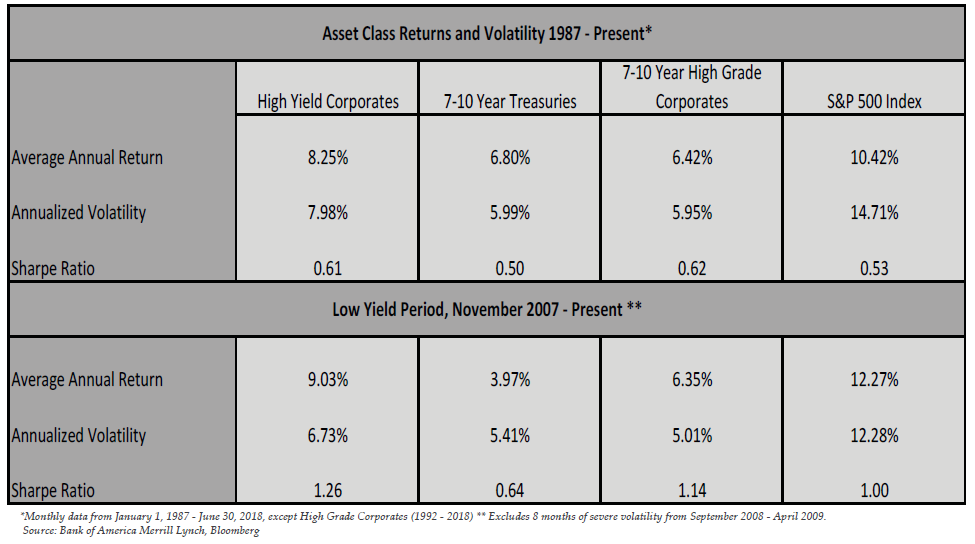
ince equities are more volatile than Treasuries, we would expect volatility to be greatest during periods of low interest rates, when the Treasury component is small and the equity component is large. That effect is mitigated by the lower volatility of all the asset classes in the low yield period. However, if Treasuries and equities are negatively correlated, as is the case during the low yield period, they would tend to offset each other and reduce overall volatility as the ratio of the two components approaches a balance point. We believe that is the explanation for the slightly lower volatility demonstrated by the high yield index during the low yield period.
Conclusion
As the economy continues to expand and the Fed continues to increase the Federal Funds rate, it is natural for investors to worry about rising rates. We share these concerns.
History tells us that high yield bonds can generate positive returns even as the general level of interest rates is rising, thanks to their large coupons and spread compression as the economy expands. Whether that happens in the future depends on many factors, most importantly the magnitude and duration of the rate increase and the current yield of the high yield bonds. We note that the coupon on high yield bonds is at an all-time low, so the current yield will not provide as much of a cushion as it has in the past. With that caveat in mind, we are cautiously optimistic that high yield bonds can deliver positive returns even if rates continue to rise.
While rising Treasury rates can lead to higher volatility and less favorable correlation characteristics, we note that the rate on the 10-year would have to rise beyond 4% before those effects become significant. Nonetheless, high yield bonds will continue to provide diversification benefits even if rates returned to their long-term averages because they are imperfectly correlated with other asset classes.
High yield portfolios can outperform in a rising rate environment in three ways. The first and most important is to populate the portfolio with high conviction alpha ideas that can outperform in any market. The second is to keep the portfolio duration below that of the index, reducing overall volatility and downside risk. The third is to underweight BB-rated issues because those are more interest rate sensitive than lower quality issues that have a larger credit component.
We believe high yield bonds are an all-season portfolio component that adds current income and enhances total returns while reducing volatility in most market environments.
Disclosures
Advent Capital Management, LLC is an investment advisor registered with the Securities and Exchange Commission under the Investment Advisers Act of 1940. Advent is an independent, privately held corporation. Advent specializes in global and domestic convertible, high yield, and event-driven strategies based on a credit focused investment process with offices in New York and London. Advent had approximately $9.5 billion in assets under management as of August 31, 2018. We manage institutional assets across long-only and hedge fund strategies. A list of all firm composites is available upon request.
We do not represent that the contents of this document, including any third party information, is accurate or complete and it should not be relied upon as such. Opinions and any forecasts of future events, returns or results expressed herein reflect the opinion of Advent, are subject to change without notice, do not reflect actual investment results, are not guarantees of future events, returns or results and are not intended to provide financial planning or investment advice. Actual future events, returns and results may vary completely and adversely from prior opinions and forecasts concerning such events, returns, and results.
The content of this article is not intended to recommend any particular security investment or investment strategy. The content of this article shall not be used or considered as an offer to sell or a solicitation of any offer to buy any securities or services of Advent Capital Management, LLC or any other issuer. Offers can only be made where lawful under, and in compliance with, applicable law. Past performance is not a guarantee of future results. It should not be assumed that results for historic portfolio investments or investment strategies will be achieved for other investments or in the future. Market conditions can vary widely over time and can result in a loss of portfolio value. No guarantee or representation is made that any investment strategy, fund or account will achieve its investment objective.
Advent Disclaimer
This page contains certain additional regulatory and other disclosures applicable to Advent Capital Management, LLC and its subsidiaries and affiliates (collectively, “Advent”). Not An Offer Of Advisory Services Or Securities This website (“Site”) is limited to the dissemination of general information about the services provided by Advent. This Site and the reports, data, information, content, software, RSS and podcast feeds, products, services, and other materials on, generated by or obtained from this Site, whether through links or otherwise (such material, together with this Site, the “Content”) does not constitute and should not be construed as an offering of advisory services or an offer to sell or a solicitation to buy any securities or related financial instruments in any jurisdiction. The Content is for informational purposes only and should not be considered as a recommendation of any particular security, strategy or investment product. No investment advice, financial advice, tax advice, or legal advice is provided through the Content, and no person is authorized to use the Content for those purposes. Any discussion or information in the Content relating to investment processes, portfolio characteristics or other matters relating to Advent, an Advent investment strategy and/or an Advent-managed separate account or collective investment vehicle (collectively, an “account”) is subject to change over time. Opinions and any forecasts of future events, returns or results that are expressed in the Content reflect the opinion of the author, are subject to change without notice, do not reflect actual investment results and are not guarantees of future events, returns or results. Responses to any inquiry that may involve the rendering of personalized investment advice or effecting or attempting to effect transactions in securities will not be made by Advent absent compliance with applicable laws or regulations (including broker dealer, investment adviser or applicable agent or representative registration requirements), or applicable exemptions or exclusions therefrom. Offerings are made only to persons who are "accredited investors" as defined in Rule 501(a) under the Securities Act of 1933, as amended. General Risk Warnings Past performance does not guarantee, and is not a reliable indicator of, future results and the performance of an account may be substantially different. Current performance may be lower or higher than performance shown in the Content. The performance of an Advent investment strategy or account may be volatile, and an investor could lose all or a substantial portion of any investment made in an Advent investment strategy or account. No representation is given that an Advent investment strategy or account is suitable for any particular investor. Market conditions can fluctuate and vary widely over time and can result in a loss of portfolio value. Advent makes no guarantee or representation that any Advent investment strategy or account will achieve its investment objective or have positive returns. Investing in financial markets involves a substantial degree of risk and there can be no guarantee that the investment objectives of an Advent investment strategy or account will be achieved. Returns presented on a gross basis are substantially higher than returns presented on a net basis because gross returns do not reflect the deduction of investment advisory fees and other expenses that would be incurred by a client. The returns of a client investment in any investment strategy will be reduced by the advisory fees and any other expenses it may incur in the management of its account. Advisory fees have a compounded effect in reducing account performance over time. The Content may contain certain forward-looking statements. By their nature, forward-looking statements involve risk and uncertainty because they relate to future events and circumstances. Actual outcomes and results may differ materially from any outcomes or results expressed or implied by such forward-thinking statements. The success or achievement of various results, targets and objectives is dependent upon a multitude of factors, many of which are beyond the control of Advent. Although Advent-generated Content has been prepared using sources, models and data that Advent believes to be reasonably reliable, its accuracy, completeness or suitability cannot be guaranteed and should not be relied upon as such by any person. The information contained in the Content does not purport to cover all matters that may be relevant for the purposes of considering whether or not to make any prospective investment. Prospective investors should conduct their own investigations in relation to the matters referred to in the Content and are recommended to consult their own advisers in relation to such matters. Revised January 2018 Advent Capital Management, LLC © 1995–2018 Advent Capital Management, LLC All rights reserved. Your use of this site signifies that you accept our terms & conditions of use.
