ElliottWave-Forecast has built its reputation on accurate technical analysis and a winning attitude. By successfully incorporating the Elliott Wave Theory with Market Correlation, Cycles, Proprietary Pivot System, we provide precise forecasts with up-to-date analysis for 50 instruments including FX majors, Gold, Silver, Copper, Oil, Natural Gas, Soybeans, Sugar ,Corn TNX and a number of Equity Indices from around the World. Our clients also have immediate access to our proprietary Actionable Trade Setups, Market Overview, 1 Hour, 4 Hour, Daily & Weekly Wave Counts. Weekend Webinar, Live Screen Sharing Sessions, Daily Technical Videos, Elliott Wave Setup videos, Educational Resources, and 24 Hour chat room where they are provided live updates and given answers to their questions. The guidance of ElliottWave-Forecast gives subscribers the wherewithal to position themselves for proper entry and exit in the Forex marketplace. We believe our disciplined methodology is pivotal for long-term success in trading.
Xiaomi Corp (1810.HK) Pulling Back in wave (IV)
Xiaomi Corporation (1810.HK), founded in 2010 and headquartered in Beijing, China, is a leading global technology company known for its innovative smartphones, IoT devices, and lifestyle products. Listed on the Hong Kong Stock Exchange since July 2018, it operates through four main segments: Smartphones, IoT and Lifestyle Products, Internet Services, and Others, offering a wide range of products from smart TVs and laptops to electric vehicles. With a strong focus on affordable, high-quality tech and a growing presence in markets like Southeast Asia and India, Xiaomi has become the world’s third-largest smartphone vendor, boasting a market cap of approximately HKD 1.365 trillion as of early 2025. Below we will look at the Elliott Wave technical outlook of the company.
Xiaomi Monthly Elliott Wave Chart
Monthly Elliott Wave Chart of Xiaomi above shows that rally from all-time low is unfolding as a 5 waves impulse. Wave (I) ended at 33.8 and pullback in wave (II) ended at 8.31. The stock rallied higher in wave (III) towards 58.7. Expect pullback in wave (IV) to correct cycle from 10.12.2022 low in 3, 7, or 11 swing before it resumes higher.
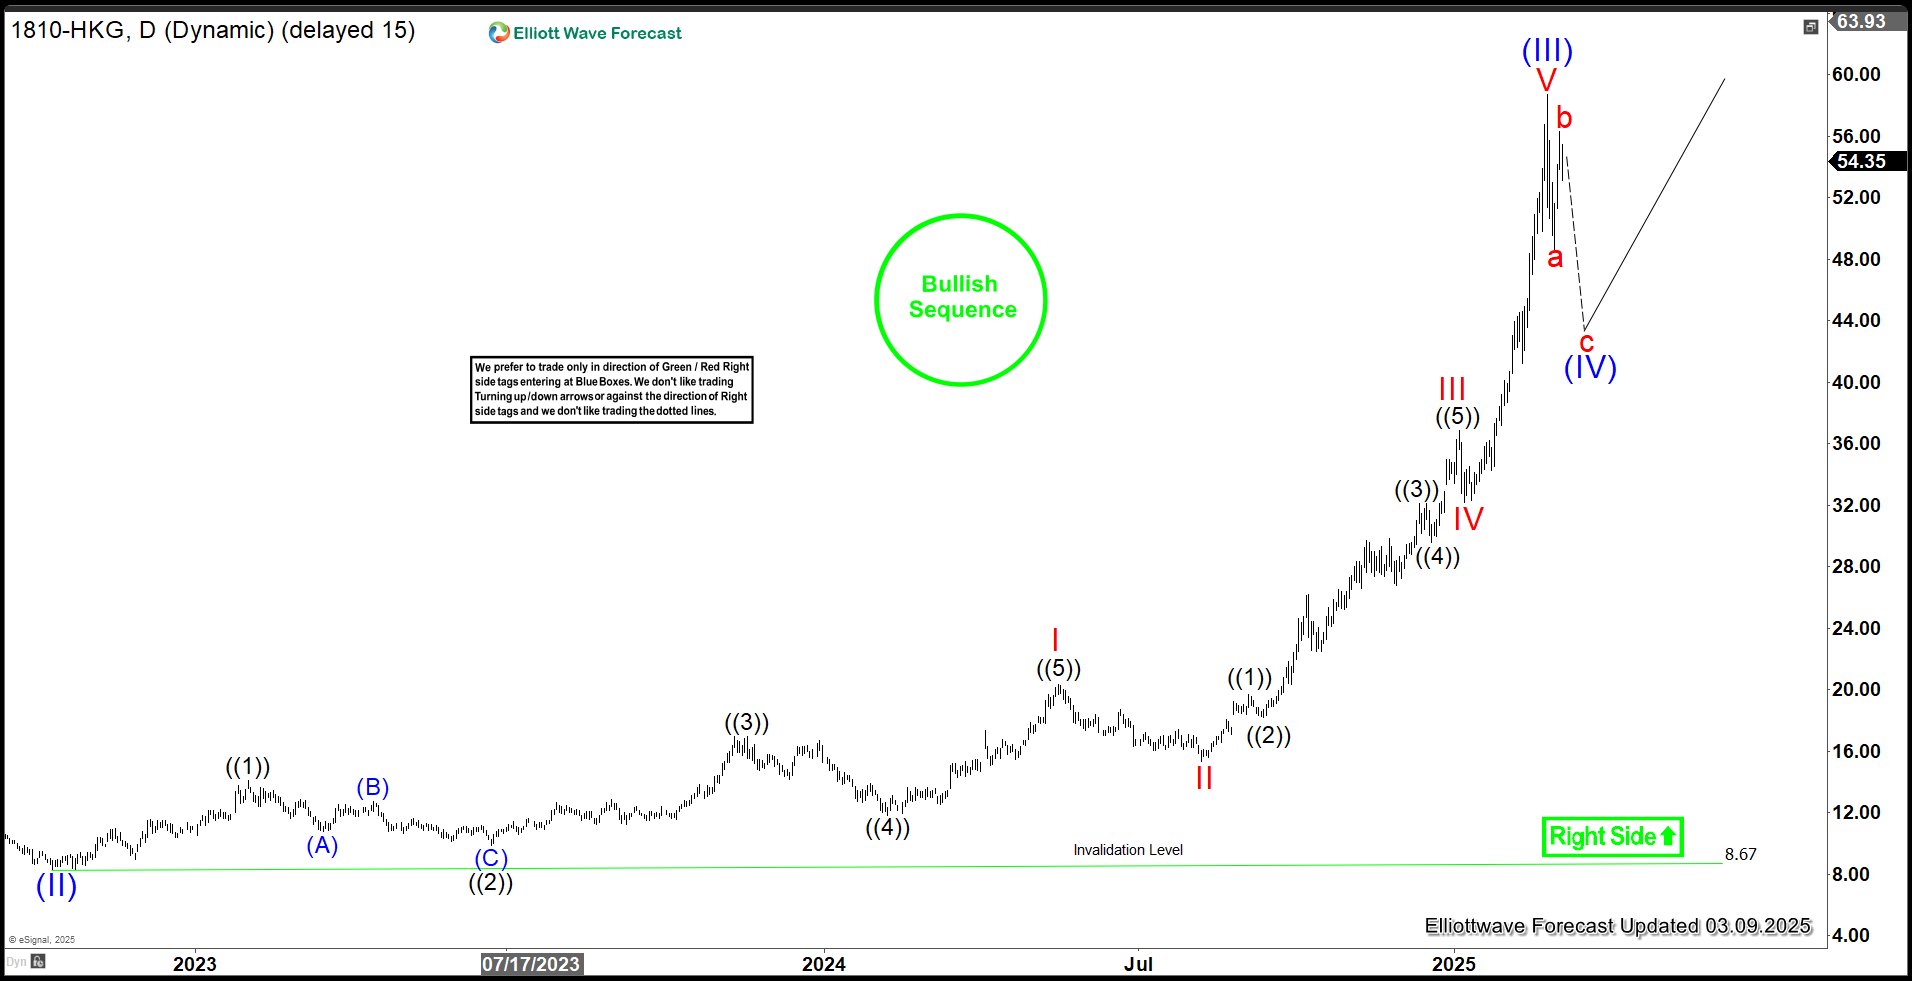
Xiaomi Daily Elliott Wave Chart
Daily Elliott Wave Chart of Xiaomi above shows that wave (II) ended at 8.67. The stock then nested higher from there. Wave I ended at 20.35 and wave II dips ended at 15.36. Stock then rallied higher in wave III towards 36.85 and pullback in wave IV ended at 32.2. Wave V ended at 58.7 which completed wave (III) in higher degree. Expect pullback in wave (IV) to correct cycle from 10.12.2022 low before it resumes higher again. While pivot at 8.67 low remains intact, expect pullback to find support in 3, 7, or 11 swing for further upside.
Source: https://elliottwave-forecast.com/stock-market/xiaomi-corp-1810-hk-pulling-back-wave-iv/


